


A year of growth and expansion
Financial statements bulletin January–December 2019 (unaudited)
Hoivatilat Plc stock exchange release, 21 February 2020 at 8 am
| Summary January-December | 31.12.2019 | 31.12.2018 | change, % |
| Total revenue (EUR thousand) | 23 273 | 17 182 | 35.4 % |
| Profit for the period (EUR thousand) | 28 244 | 37 003 | -23.7 % |
| EPRA Earnings (EUR thousand) | 8 856 | 7 663 | 15.6 % |
| Earnings per share, undiluted (EUR) | 1.11 | 1.46 | -24.0 % |
| Earnings per share, diluted (EUR) | 1.11 | 1.45 | -23.4 % |
| EPRA Earnings Per Share (EUR) | 0.35 | 0.30 | 15.5 % |
| Value of investment properties (EUR thousand) | 490 791 | 348 899 | 40.7 % |
| NAV per share (EUR) | 8.54 | 7.28 | 17.1 % |
| Value of the lease portfolio (without index increases, EUR thousand) | 584 139 | 426 953 | 36.8 % |
| Economic occupancy rate (%) | 100 | 100 | – |
| Average maturity of the lease portfolio (years) | 15.8 | 14.9 | – |
| Summary July-December | 7-12/2019 | 7-12/2018 | change, % |
| Total revenue (EUR thousand) | 12 380 | 9 121 | 35.7 % |
| Profit for the period (EUR thousand) | 15 947 | 21 047 | -24.2 % |
| EPRA Earnings (EUR thousand) | 3 962 | 4 510 | -12.1 % |
| Earnings per share, undiluted (EUR) | 0.63 | 0.82 | -23.2 % |
| Earnings per share, diluted (EUR) | 0.63 | 0.82 | -23.2 % |
| EPRA Earnings Per Share (EUR) | 0.16 | 0.18 | -11.1 % |
The impact of IFRS 16, adopted on 1 January 2019, on the key figures for the review period are shown in the Financial review section and the table section. Earnings include EUR 1.4 million non-recurring expenses arising from the public tender offer (EUR 1.8 million before tax).
Significant events
- The Belgian Aedifica SA/NV becomes the principal owner of Hoivatilat
- Significant new projects in school sector. Most recently announced a school in Espoo for 500 students with 25-year lease agreement
- A record high number of 19 new tenants during the year. Especially the number of public and third sector tenants grew.
Outlook for 2020
Hoivatilat estimates that its revenue will increase at least 20 per cent in 2020 compared with 2019. EPRA Earnings are expected to be around 40 per cent of revenue. The fair value of investment properties at the end of 2020 is estimated to be around EUR 600 million. The guidance is based on the assumption that, in 2020, the company will not make significant purchases or sales of completed investment properties, and that the market yields used in the valuation of real estate will remain at their current level.
Jussi Karjula, CEO:
For Hoivatilat, 2019 was a year of growth and expansion. Our organisation grew and strengthened, and we expanded our offering and established a large number of customer relationships. At the same time, our key indicators improved considerably. In terms of balance sheet and sales indicators, Hoivatilat broke earlier records.
The most significant growth was achieved in the value of investment properties and the value of the agreement portfolio, both of which increased by around 40 per cent. Value of investment properties increased by EUR 28.6 million as a result of the adoption of the IFRS 16 standard (growth without the impact of IFRS 16 was 32.5 per cent). The value of the company’s agreement portfolio describes the value of leases (excluding index increases) – that is, expected future revenue. The value of the agreement portfolio was EUR 584.1 million at the end of the year. The average maturity of the agreement portfolio reached a record level of 15.8 after the company had signed several 20–25-year leases during the year.
With the completion of new properties, the company’s revenue continued to grow strongly, by 35.4 per cent during the year. Net asset value (NAV) per share, a key indicator in real estate business, increased by 17.1 per cent to EUR 8.54. Profit for the period was 23,7 per cent lower than the year before. This was mainly due to smaller changes in investment properties market return requirements. The property development margin has remained good, in line with the company’s targets
Hoivatilat expanded its business operations on many fronts during the year. In Sweden, its business operations developed according to plan. Hoivatilat AB signed agreements on the implementation of seven property projects last year. The construction of four projects began in 2019, and the first properties will be completed in the spring of 2020. At the beginning of 2020, Hoivatilat AB has a three-member team of its own, as well as a well-functioning network of local partners.
The customer base has expanded in the municipal sector in particular, but also in the third sector and among corporate customers. Last year, Hoivatilat won seven municipal projects through public tendering and two public tendering processes in the third sector. Four of these projects were schools.
During the year, the company implemented not only school, day-care centre and nursing home projects, but also shelters and children’s homes, as well as hybrid and service community buildings that combine various services. Hoivatilat has a diverse range of projects underway that combine housing with services. A service community including a day-care centre, a nursing home, apartments for senior citizens, a restaurant and a dog day-care facility will be completed for the Housing Fair 2020 event in Tuusula next summer.
On 4 November 2019, Aedifica SA/NV, a Belgian listed company specialising in care facilities, made a public tender offer (through its wholly owned Finnish subsidiary, Aureit Holding Oy) for all shares in Hoivatilat. The Board of Directors of Hoivatilat recommended that the shareholders accept the offer. The tender offer expired on 3 January 2020 and the subsequent offer period expired on 27 January 2020 after which Aedifica announced that it holds 98.2 per cent of all shares in Hoivatilat. Aedifica announced that it has on 15 January 2020 filed an application with the Redemption Board of the Finland Chamber of Commerce to initiate statutory redemption proceedings for the remaining Shares. Hoivatilat will continue to operate as a Finnish company as part of Aedifica Group. As a result of the completion of the public tender the company incurred non-recurring expenses of approximately EUR 1.8 million. The costs consist, among other things, of advisory fees. These expenses had a negative impact on 2019 profit for the period as well as on EPRA Earnings.
Material events during the review period
The company regained holding of 23,134 of its own shares in accordance with the terms and conditions of the 2015 share incentive scheme. The shares were returned on 27 February 2019, and after that Hoivatilat Plc holds 23,134 treasury shares. (Stock exchange release 28 February 2019)
The first projects in Sweden started. The company signed an agreement on the implementation of day-care centres in Eskilstuna, Ronneby and Norrtälje. The total investment value of the three day-care centres is around EUR 11 million. In addition, the company signed agreements on four projects for municipal tenants: a school in Mikkeli and day-care centres in Oulu, Rovaniemi and Vaasa. (Stock exchange release 26 March 2019)
Timo Wikberg was appointed as Business Director and a member of the management team of Hoivatilat. He will be responsible for managing and developing Hoivatilat’s sales and customer experience. Wikberg has previously worked for Attendo in various business development and managerial positions, most recently as Sales Director. (Stock exchange release 4 April 2019)
On 11 April 2019, Hoivatilat signed an agreement on a domestic EUR 100 million commercial paper programme. Within the programme, the company may issue commercial papers of less than one-year maturity. This arrangement diversifies the company’s financing base, as well as secures the Group’s normal investment and working capital financing. (Stock exchange release 11 April 2019)
The change of name, decided at the Annual General Meeting of Suomen Hoivatilat Oyj on 26 March 2019, was registered with the Trade Register on 9 May 2019. The new name of the company is Hoivatilat Oyj in Finnish and Hoivatilat Plc in English. (Stock exchange release 9 May 2019)
On 4 November 2019, Hoivatilat published preliminary information about its third-quarter result and revised its guidance for 2019. (Stock exchange release 4 November 2019)
On 4 November 2019, the company announced that Hoivatilat and Aureit Holding Oy, a wholly owned subsidiary of the Belgian listed company Aedifica SA/NV, had signed a combination agreement, according to which Aureit Holding Oy will make a recommended public cash tender offer for all shares in Hoivatilat Plc. The cash consideration offered as part of the tender offer is EUR 14.75 per share. On 6 November 2019, the Board of Directors of Hoivatilat Plc issued a statement concerning the tender offer. On 8 November 2019, Aureit Holding Oy published the offer document and announced that the offer period would begin on 11 November 2019. (Stock exchange releases 4, 6 and 8 November 2019)
On 5 November 2019, the company’s Board of Directors decided to carry out a directed share issue without consideration to the participants in its long-term share-based incentive plan for the payment of share rewards in accordance with the plan. In the directed share issue, 63,400 new shares in the company will be issued without consideration to participants entitled to share rewards in accordance with the share-based incentive plan. After the directed share issue, the total number of shares in the company will be 25,502,629, including treasury shares held by the company. The new shares were registered with the Trade Register on 13 November 2019, and trading began on 14 November 2019. (Stock exchange releases 6 and 14 November 2019)
On 22 November 2019, the company was informed about a negative statement published by Clearance Capital concerning Aedifica’s tender offer for all shares in Hoivatilat. (Stock exchange release 22 November 2019)
On 25 November 2019, the Espoo Christian School Support Association selected Hoivatilat Plc to implement a school and day-care centre construction project in Matinkylä in Espoo in accordance with the lease model. The school will be completed in August 2021. The duration of the lease is 25 years, and the value of the agreement is around EUR 30 million. (Stock exchange release 26 November 2019)
On 27 November 2019, Aureit Holding Oy decided to amend the terms and conditions of its recommended public cash tender offer for all shares in Hoivatilat Plc as follows: the offeror (together with Aedifica and any entities controlled by Aedifica) must acquire more than 50 per cent (previously: more than 90 per cent) of the outstanding shares and votes in Hoivatilat. On 28 November 2019, Aureit Holding Oy announced that it would supplement the offer document dated 8 November 2019. On 28 November 2019, the Board of Directors of Hoivatilat Plc supplemented its statement on the tender offer without amending its recommendation. (Stock exchange releases 27 and 28 November 2019)
On 5 December 2019, Aureit Holding Oy decided to increase the offer consideration to EUR 16.00 per share. Consequently, the company decided to amend the terms and conditions for its voluntary recommended public cash tender offer for all shares in Hoivatilat Plc and to extend the offer period until 3 January 2020. On 5 December 2019, the Board of Directors of Hoivatilat Plc supplemented its statement on the tender offer due to the increase in the offer consideration. On 9 December 2019, Aureit Holding announced that it would supplement the offer document dated 8 November 2019. (Stock exchange releases 5 and 9 December 2019)
Operating environment
Urbanisation continues in Finland and in the rest of Europe, and the population is ageing. Finland has the most rapidly ageing population in Europe. In Finland, the number of people aged over 75 will nearly double over the next two decades. At the end of 2017, the number of people aged over 75 in Finland was around 500,000, and this number is predicted to increase to 925,000 by the end of 2040 (Statistics Finland, stat.fi). The trend is very similar in Sweden: the number of people aged over 75 will increase by 50 per cent by 2030.
Over the past two decades, the population of the Helsinki-Uusimaa region has increased by almost 500,000 people. Approximately 70 per cent of Finland’s population is already living in and around the 14 largest towns and cities.
Hoivatilat estimates that the following trends will increase its opportunities for growth and operations:
• Ageing population and the weakening dependency ratio
• Urbanisation and the concentration of the population
• Increased debt in the public sector
• Condition of properties in education and the social and health sectors
• Change in municipal procurement practices (lease model)
• Increasing use of service vouchers in early education and care services
Hoivatilat is preparing to the possible Finnish social and healthcare reform by monitoring closely the status of the process and by preparing to create a well-functioning collaboration with the organizers of the possible new social and healthcare system.
Even properties age
The municipal portfolio of education, culture, social services and healthcare properties include a large number of old buildings nearing the end of their life cycle, as well as properties with indoor air problems and a maintenance backlog that require renovation. On 17 October 2019, the Finnish Prime Minister’s Office published Indoor Air and Health, a report examining the current state of indoor air quality and the number of indoor air issues in the private and public sectors. Based on the responses provided by municipalities, significant indoor air problems affect 11–18 per cent of the total amount of square meters of various types of buildings. The most significant problems are related to comprehensive school and upper secondary school facilities, 60–70 per cent of which were built before 1980.
Hoivatilat has paid special attention to making premises safe and minimising indoor air issues. The company applies its Terve Rakennus (Healthy Building) concept to all property projects. Digitalisation and IoT enable new methods of monitoring indoor air quality and the structures of a property. In these areas, Hoivatilat is a pioneer in its field.
The planning and implementation of our facility projects are based on life cycle ownership and responsible contracting. This means safe, healthy and modifiable facilities. In construction, we favour low-carbon buildings, renewable material and energy solutions, and intelligent property control and lighting solutions.
Economic operating environment
In its economic forecast on 18 December 2019, the Ministry of Finance estimated that Finland’s GDP would grow by 1.6 per cent in 2019. According to the Ministry of Finance, investments in residential construction will decrease and investments in production will increase at a slower pace. With employment and income levels increasing, private consumption will continue to grow. Exports will grow more rapidly because of an increase in service exports and ship deliveries.
The Ministry of Finance predicts that Finland’s GDP will grow by around one per cent in 2020. Service exports will continue to grow rapidly, which is why exports will grow more rapidly than demand. Private consumption will continue to increase steadily. Higher income levels will maintain growth in household income. Public consumption will grow more rapidly, which will increase the share of domestic demand. Private investments are predicted to decrease in 2020 because of lower levels of investments in residential construction. The number of employed people will increase by 0.5 per cent in 2020. Slower economic growth and higher nominal wages will weaken the growth of employment. The nominal income level is expected to increase by three per cent.
According to Euro and the Economy, a report published by the Bank of Finland on 17 December 2019, based on forward guidance given by the European Central Bank (ECB), interest rates are expected to remain at the current level or lower until the inflation outlook returns sufficiently close to but still under 2 per cent, and until this trend is consistently reflected in core inflation. Interest rate levels continue to be low. The main refinancing operations rate is 0.00 per cent, the marginal lending facility rate is 0.25 per cent, and the deposit facility rate is -0.50 per cent.
The loosening of monetary policy continued during the autumn in other respects as well. At its September meeting, the Governing Council of the ECB decided to restart net purchases under its asset purchase programme. The Governing Council also decided to implement additional measures to preserve favourable bank lending conditions. All in all, monetary policy will remain very loose for longer than was predicted in June.
Financial review
Financial development
The Group’s revenue was EUR 23.3 (17.2) million, representing an increase of 35.4 per cent year-on-year. The revenue consisted entirely of rental income. The increase in revenue was mostly due to considerable growth over the past 12 months in the number of properties that the company has leased. The income from measuring properties at fair value was EUR 24.2 (35.6) million in the review period. In the category of investment properties, the change in fair values on the income statement includes EUR -0.7 (0.0) million in depreciation on leasehold plots presented as an asset item in accordance with IFRS 16. The change in the fair values of investment properties was smaller than in the comparison period, because the changes in return requirements used for measuring the properties were more moderate. The net return of the portfolio decreased by 0.12 percentage points, while it had decreased considerably more, by 0.31 percentage points, during the corresponding period in the previous year. The property development margin has remained good, in line with the company’s targets.
The net rental income for the review period was EUR 22.4 (15.9) million, representing an increase of 41.2 per cent. At the end of the review period, the company had 150 (120) completed properties generating rental cash flow. Their net return was 6.03 per cent (6.15 per cent). The decrease in the net return rate was mostly due to a decrease in the required market rates of return used in measuring the value of investment properties.
Property maintenance expenses totalled EUR -1.0 (-1.3) million. Property maintenance expenses decreased by 27.0 per cent year-on-year. The decrease in maintenance expenses is explained by the amendments to IFRS 16. From 1 January 2019, the land lease expenses that were previously included in property maintenance expenses are presented as part of the change in fair value and as part of interest expenses. The impact of the amendments to IFRS 16 on the maintenance expenses was EUR 0.8 million in the review period.
Expenses arising from employment benefits were EUR -3.2 (-2.5) million, representing an increase of 30.3 per cent. In addition to recruitment during the review period, personnel expenses increased because of an expense of EUR -0.3 million recognised due to the discontinuation of the second earning period of the share-based incentive plan (2018). Expenses arising from employee benefits also include a tax refund of EUR 0.2 million associated with the shares returned to the company in compliance with the terms and conditions of the share incentive scheme (23,124 shares, stock exchange release dated 28 February 2019).The average number of employees was 20 (17) during the review period.
Administrative expenses were EUR -4.5 (-1.9) million, representing an increase of 138.7 per cent year-on-year. The increase in administrative expenses is mainly explained by EUR 1.8 million in non-recurring expenses arising from the implementation of the public tender offer by Aureit Holding Oy. Administrative expenses also include a non-recurring provision for bad debt EUR 0,4 million concerning one tenant and investment property.
The operating profit was EUR 38.7 (48.5) million, representing a decrease of 20.1 per cent. The decrease in the operating profit was mainly due to a smaller change in the return requirements for properties year-on-year and the non-recurring expenses arising from the implementation of the public tender offer by Aureit Holding Oy.
Net financial income and expenses were EUR -3.3 (-2.1) million. The amendments to IFRS 16 had an impact of EUR -0.4 (0.0) million financial expenses. Taxes based on the taxable income for the review period were EUR -0.0 (-0.0) million. Deferred taxes, which were mainly due to changes in the fair values of properties, amounted to EUR -7.2 (-9.4) million.
The net profit for the review period was EUR 28.2 (37.0) million, showing a decrease of 23.7 per cent year-on-year. Undiluted earnings per share were EUR 1.11 (1.46), and diluted earnings per share were EUR 1.11 (1.45).
EPRA Earnings for the review period were EUR 8.9 (7.7) million, representing an increase of 15.6 per cent. EPRA Earnings represented 38.1 per cent (44.6 per cent) of net sales. EPRA Earnings for the review period are not comparable to the previous year because of changes caused by the adoption of IFRS 16 (as of 1 January 2019) and the non-recurring expenses arising from the implementation of the public tender offer.
Investments
The consolidated balance sheet total at the end of the review period was EUR 511.9 (364.3) million, showing an increase of 40.5 per cent year-on-year. During the review period, investments with a total acquisition cost of EUR 88.5 (81.5) million were made in properties.
Funding
The company’s interest-bearing liabilities stood at EUR 286.8 (170.4) million at the end of the review period. The net amount of interest-bearing liabilities increased by EUR 116.3 (60.4) million during the review period. Of the increase in interest-bearing liabilities, EUR 28.8 million was due to the recognition of a lease agreement liability in accordance with IFRS 16.
On 31 December 2019, the company’s potential sources of financing consisted of cash assets (EUR 16.2 million), undrawn credit facilities (EUR 5.3 million), investment loans drawn under loan agreements (EUR 11.0 million), undrawn EIB loan facility (EUR 20 million) and commercial papers which can be issued under a commercial paper scheme (EUR 55 million).
According to the company’s interest rate hedging policy, 30–50 per cent of the Group’s loan portfolio is hedged by interest rate swaps so that the average interest rate maturity is two years, plus or minus six months. The hedging coverage ratio of the company’s loan portfolio was 29.5 per cent (35.8 per cent) on 31 December 2019, and the average interest rate maturity of its loan portfolio was 1.51 (1.93) years. On 10 December 2019 the board of directors decided that the company will not comply with its hedging policy for the time being.
Properties and agreements
On 31 December 2019, the company had 150 (120) completed properties generating rental cash flow. In addition, properties under construction or in the start-up phase totalled 44 (39). During the review period, a total of 27 (35) new properties were completed, and the company acquired 3 (1) completed properties.
| Properties 31.12. | Completed | In progress and not started* | Total | |||
| 31 Dec 2019 | 31 Dec 2018 | 31 Dec 2019 | 31 Dec 2018 | 31 Dec 2019 | 31 Dec 2018 | |
| Number of properties | 150 | 120 | 44 | 39 | 194 | 159 |
| Leasable area, thousand floor m² | 129.5 | 105.2 | 70.2 | 45.8 | 199.7 | 151.0 |
| Annual rents, EUR million | 26.4 | 21.5 | 13.4 | 8.4 | 39.8 | 29.9 |
| Investment (acquisition cost), EUR million | 300.1 | 237.8 | 198.4 | 122.1 | 498.5 | 359.9 |
| * = Properties in progress and not started also include properties for which binding leases or preliminary agreements have been signed, but construction has not yet begun. |
||||||
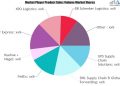
On 31 December 2019, the company had a total of 194 (159) leases (including preliminary agreements), which were divided between 50 (31) customers, including 10 (3) municipal customers. The value of the lease portfolio was EUR 584.1 (427.0) million, and the average maturity of the entire lease portfolio was 15.8 (14.9) years. The company’s three largest key customers represented around 39 per cent (54 per cent) of its lease portfolio on 31 December 2019. The largest customer’s share of the lease portfolio was 20 per cent (27 per cent). The second-largest customer’s share was 12 per cent (17 per cent), and that of the third-largest customer was 7 per cent (9 per cent). Municipal customers represented 14 per cent (6 per cent) of the lease portfolio. In euro terms, the most important tenants are Finland’s largest chains in the nursing and day-care sector.
Of the lease portfolio, 65 per cent (65 per cent) consisted of rental income from properties located in the Greater Helsinki area/Uusimaa region and the Tampere, Lahti, Turku, Oulu, Kuopio and Jyväskylä regions. Of the lease portfolio, 20 per cent (20 per cent) consisted of properties in other municipalities with more than 30,000 residents, and 11 per cent (15 per cent) consisted of properties located in municipalities with fewer than 30,000 residents. The properties in Sweden represented 4 per cent (0 per cent) of the lease portfolio.
| Area | 31 Dec 2019 | 31 Dec 2018 | |
| Greater Helsinki area / Uusimaa region | 28 % | 21 % | |
| Lahti region | 5 % | 7 % | |
| Tampere region | 6 % | 7 % | |
| Turku region | 7 % | 10 % | |
| Oulu region | 9 % | 8 % | |
| Kuopio region | 6 % | 8 % | |
| Jyväskylä region | 4 % | 5 % | |
| Sweden | 4 % | 0 % | |
| Other municipalities with more than 30,000 residents | 20 % | 20 % | |
| Other locations | 11 % | 15 % | |
| Total | 100 % | 100 % |
Shares and shareholders
On 31 December 2019, the company had 25,502,629 (25,439,229) shares. Of these, 23,134 were treasury shares. The closing price of the company’s shares on 31 December 2019 was EUR 16.00 (7.90), and the total market value of outstanding shares was EUR 408.0 (201.0) million. During the financial year, the highest closing price was EUR 16.05 (8.53), with the lowest being EUR 7.71 (7.20). A total of 9.0 (9.3) million shares in Hoivatilat Plc were traded during the financial year. On 31 December 2019, the company had a total of 7,005 (8,913) shareholders.
Flagging notifications
On 29 August 2019, OP Fund Management Company Ltd announced that the OP-Finland equity fund’s total number of shares and votes in Hoivatilat had fallen below 5 per cent following a transfer of shares on 28 August 2019. The OP-Finland equity fund is managed by OP Fund Management Company Ltd. The total holding of investment funds managed by OP Fund Management Company Ltd was 6.96 per cent on 28 August 2019.
Group structure
At the end of the financial period on 31 December 2019, the Hoivatilat Group consisted of its parent company, Hoivatilat Plc, and 149 (131) mutual real estate companies, as well as the Hoivatilat AB Group, which consisted of its parent company, Hoivatilat AB, and 9 (0) subsidiaries. The parent company, Hoivatilat Plc, owns 100% of all Group companies.
Assessment of operational risks and uncertainties
Financial and strategic risks
The uncertainty in the global economy and the financial markets may affect the company. If the Finnish economy develops unfavourably in the future and regional differences grow, this may have an adverse effect on the company’s operations, result, financial position and/or future outlook.
Strategic risks include the competitive situation in the market and dependence on a limited number of customers. Interest in the sector as an investment has grown considerably, which has resulted in new operators entering the market. The company’s future growth depends on the successful implementation of the company’s business strategy.
The property projects owned by Hoivatilat have been designed and developed to be used as nursing homes and day-care centres and for service communities combining these services. However, the company ensures as early as the design stage of property projects that the premises can be modified and thus also used for purposes other than nursing homes and day-care centres. Nevertheless, it is not certain that the use of the properties for other purposes, such as residential or office use, would necessarily be possible if there were no longer a need according to the original purpose. If materialised, this risk may have a material adverse effect on the company’s business operations, result, financial position and/or future outlook. Considerable changes in legislation and official regulations may also affect the company’s business operations and, subsequently, the demand for properties.
The company’s strategic goal is to grow faster than the market. According to the estimate of the management of Hoivatilat, the company may pursue result improvement primarily through the implementation of new property projects and an increase in revenue. According to the management’s estimate, the implementation of new property projects and an increase in revenue in accordance with the objective requires finding new property projects, developing and expanding existing customer relationships, obtaining new customers and expanding the operations geographically. There is no guarantee that the company succeeds in finding new property projects or acquiring new customers.
Operational risks
Operational risks include dependence on key employees’ competence and possible changes in the demand for the properties produced by the Group. The materialisation of any risk related to the company’s nature as a growth company may have a material adverse effect on the company’s business operations, result, financial position and/or future outlook.
The three largest customers of Hoivatilat represent around 39 per cent of its lease portfolio. There is no guarantee that the company’s largest customers will remain solvent. Changes in key customers’ operating environments, strategies or behaviour, or the loss of rental income from one or more key customer, may have material adverse effects on the company’s business operations, business result, financial position and/or future outlook.
Accident risks
Accident frequency in the construction industry is higher than in many other sectors. Construction sites are by nature dangerous work environments, where serious injuries or even fatal accidents can happen. Any and all accidents have an adverse effect on the company’s business operations and personnel wellbeing. Accident investigations carried out in cooperation with the authorities involve costs and delay construction. The company’s insurance premiums increase if the accident frequency becomes higher. In addition, accidents may result in civil and criminal liabilities, based on applicable laws, for the company and its management and employees. Accidents may also harm the company’s reputation. The materialisation of any risk related to employees’ health and safety may have a material adverse effect on the company’s business operations, result, financial position and/or future outlook.
The company’s properties are built by reliable and experienced construction companies that are typically responsible for the entire project. Risks related to construction and property maintenance can be considered to include any moisture damage and indoor air impurities, which may cause interruptions in the operations of Hoivatilat and have an adverse effect on its reputation. The company has prepared for such risks through clauses in agreements and by taking into account that the contractor’s guarantee for built facilities is two years and their responsibility spans ten years in accordance with the general terms and conditions concerning turnkey projects.
The company estimates that it carries insurance cover typical of the industry and sufficient insurance cover in case of common accidents. The company has insured its properties with full-value insurance. The company’s management and Board of Directors have valid liability insurance.
Financial risks
Expanding the scope or geographical area of the operations requires sufficient working capital and the availability of both equity and external capital. A potential uncertain situation prevailing in the financial market, potential general weakening in available funding and increased financial expenses may have an adverse effect on the company’s opportunities to obtain additional funding in the future or may weaken the liquidity of properties, which could result in difficulties selling the properties.
Changes in the interest rate level have a considerable impact on the real estate business. Changes in the market rates and interest rate margins may impact the company’s financial expenses and income. Changes in the interest rate level affect the interest rate expenses of the company’s variable-rate loans, which will increase as the market rates increase. The company carefully monitors the development of the interest rate level and actively hedges against the impact of changes in the interest rates. The company primarily uses interest rate swaps to manage the interest rate risk. The fair value of the interest rate swaps and the payable and receivable cash flow in accordance with the agreement depend on changes in the interest rate level. Profit or loss generated by the agreements to the company has not been limited, and thus a considerable decrease in the interest rate level, for example, may result in interest rate swaps having a material adverse effect on the company’s cash flow, financial position and/or future outlook. Although the company believes that it can manage its interest rate risks, it is not certain that the company’s hedging measures are effective or that the interest rate fluctuations do not have a material adverse effect on the company’s cash flow, financial position and/or future outlook.
The company’s rental receivables are associated with a risk of customers not being able to repay their loans when the loans fall due. As a rule, the company’s leases include a security deposit equal to 3–6 months of rent, which from the company’s perspective reduces the risks and loss of income caused by clients’ potential financial difficulties. The occupancy rate of the properties and the financial situation of the tenants are monitored by means of regular meetings and financial monitoring.
Responsibility and environmental considerations
In 2018, Hoivatilat began to determine its sustainability focuses. An internal materiality analysis was carried out to assess and define the most essential sustainability focuses for the company’s operations. Four focus areas were defined: customer-oriented offering and operating methods, people’s well-being, environmental responsibility and social responsibility. A Sustainability Committee was established in 2019 to support sustainability work.
Customer orientation
The company’s vision is to create a superior customer experience as a developer of properties for education, culture, social services and healthcare. In terms of its customer-oriented offering and operating methods, the company focuses on a superior customer experience and the continuous development of the user experience.
Customer satisfaction is measured through an annual customer satisfaction survey. In the 2019 customer satisfaction survey, the company received good feedback on its construction projects staying on schedule and on its understanding of the special regulations related to construction in its sector.
In addition to providing a superior customer experience and a continuous service offering, Hoivatilat works to be a reliable contractual partner with responsible operating methods and a good reputation.
Through digitalisation, the company has been able to further develop systems that support enterprise resource planning and life cycle ownership year after year.
Participatory design in property projects is one of the ways in which the company has further developed customer-oriented operating method. For example, Hoivatilat organised a participatory workshop for a new site in Oulu in June 2019. At the workshop, the children of the Pateniemi and Metsämarja day-care centres participated in designing the outdoor areas of the day-care centre to be built in the greater Pateniemi area.
People’s well-being
Concerning people’s well-being, Hoivatilat works to provide its employees with interesting and meaningful jobs while also providing an inspiring and continuously developing working environment. The employee experience is measured annually. In August 2019, Hoivatilat carried out a Great Place to Work survey, as in the previous year. Hoivatilat’s Trust Index score was excellent: 96. The Trust Index score indicates the percentage of respondents who consider their workplace to be good or very good. The average Trust Index score for Finnish workplaces is 56.
Environmental responsibility
In the properties Hoivatilat builds and owns, it seeks optimal solutions that benefit the residents and users of the properties, as well as the environment. In terms of environmental responsibility, Hoivatilat aims to promote low-carbon construction, energy efficiency and the use of renewable energy forms.
The energy efficiency of buildings can be monitored and controlled through digitalisation and automation. Nearly all properties are monitored remotely. This enables the centralised management of heating and ventilation in properties, as well as making it possible to affect property life cycles, adjust heating according to the conditions and ensure optimal ventilation.
The pilot projects started in previous years to monitor indoor air quality and improve energy efficiency continued in 2019, and the company also started a number of new experiments. Experiments to monitor energy efficiency and the indoor climate took were organised in five properties in 2019.
In 2019, Hoivatilat decided to have its carbon footprints and handprints calculated for each new property project. Hoivatilat also looked into the certification of property projects in 2019. The RTS environmental classification system was found to be the most suitable option for Hoivatilat. The company is planning to pilot its introduction in property projects during 2020 and 2021.
Personnel
Hoivatilat provides solutions for growth. The company grows with its customers and partner network. All operations focus on the customers, and the employees seek to offer a superior customer experience in providing properties for culture, education, social services and healthcare.
Hoivatilat’s operating method is based on networks. A small, highly efficient team is responsible for the coordination and development of networks. This team focuses on key project tasks, such as customer relationship management, administration, project development, construction and property management. With the help of an extensive and competent partner network, Hoivatilat can carry out a large number of new property projects each year, as well as managing its current property portfolio.
At the end of 2019, Hoivatilat had a CEO and 24 employees. The company had 16 employees in Oulu, 7 in Espoo and 2 in Stockholm. Six new employees were recruited during the year to strengthen competence in construction, administration, marketing, new business concept development and international operations. The company is headquartered in Oulu, with offices in Espoo and Stockholm.
Board of Directors and company management
Until the extraordinary general meeting of 4 February 2020, the Board of Directors of Hoivatilat consisted of Pertti Huuskonen (Chairman), Satu Ahlman, Nathalie Clément, Paul Hartwall, Kari Nenonen and Reijo Tauriainen. Harri Aho and Timo Pekkarinen served as Board members until 26 March 2019.
Until 4 February 2020, the Audit Committee consisted of Reijo Tauriainen (Chairman), Paul Hartwall and Kari Nenonen and the Remuneration Committee consisted of Pertti Huuskonen (Chairman), Satu Ahlman and Paul Hartwall. The company’s auditor is KPMG Oy Ab, Authorised Public Accountants, with APA Antti Kääriäinen as the principal auditor.
Until 10 January 2020, the Shareholders’ Nomination Board consisted of Stefan Björkman, Juha Takala and Johannes Winborg. Pertti Huuskonen, Chairman of the Board of Directors of Hoivatilat Plc, served as an expert member on the Nomination Board until 10 January 2020. The extraordinary general meeting on 4 February 2020 decided to discontinue the Shareholders’ Nomination Board.
The Group’s management team consists of Jussi Karjula, CEO; Riku Patokoski, Deputy CEO; Tommi Aarnio, CFO; Juhana Saarni, Real Estate Director; Riikka Säkkinen, HR and Communications Director; and Timo Wikberg, Business Director. Account Director Jussi Vikman was appointed as a member of the management team on 13 January 2020.
Decisions of the Annual General Meeting
The Annual General Meeting of Hoivatilat was held in Helsinki on 26 March 2019. The Annual General Meeting confirmed the financial statements and discharged the members of the Board of Directors and the CEO from liability for the 2018 financial year. KPMG Oy Ab, Authorised Public Accountants, was selected as the company’s auditor, with APA Antti Kääriäinen as the principal auditor. A dividend of EUR 0.17 per share was paid on 4 April 2019 in accordance with the Annual General Meeting’s decision. In addition, the Annual General Meeting adopted the proposals of the Board, according to which the Board was authorised to decide on the acquisition of treasury shares and the issuance of new shares. The Annual General Meeting also approved an amendment to the Articles of Association with regard to the name of the company (Hoivatilat Oyj), as well as the Nomination Board’s proposal for the composition of the Board of Directors and Board members’ fees. Its decisions were announced on 26 March 2019. They are also available on the company’s website.
Events after the end of the financial year
On 7 January 2020, the company announced that according to the preliminary result of the tender offer made by Aureit Holding Oy, the shares for which the tender offer had been approved, together with the Hoivatilat shares acquired by the offeror through public trading on the Nasdaq Helsinki, represented 95.5 per cent of all issued and outstanding shares and votes in Hoivatilat. On 9 January 2020, the company announced that according to the final result of the tender offer, the shares for which the tender offer had been approved, together with the Hoivatilat shares acquired by the offeror through public trading on the Nasdaq Helsinki, represented 95.9 per cent of all issued and outstanding shares and votes in Hoivatilat. As the final result of the tender offer exceeds the minimum acceptance condition and all other conditions for the completion of the tender offer have been fulfilled or waived by the offeror, the offeror will complete the tender offer in accordance with the terms and conditions of the offer. On 30 January 2019, the company announced that according to an announcement made by Aureit Holding Oy, Aureit Holding Oy holds 98.2 per cent of all shares in Hoivatilat after the end of the subsequent offer period of the tender offer. Aedifica announced that it has on 15 January 2020 filed an application with the Redemption Board of the Finland Chamber of Commerce to initiate statutory redemption proceedings for the remaining Shares. (Stock exchange releases 7, 9 and 30 January 2020)
On 27 January 2020 the company announced that as a result of the completion of the public tender offer by Aureit Holding Oy, a Finnish limited liability company wholly owned by Aedifica SA/NV, Hoivatilat Plc incurred non-recurring expenses of approximately EUR 1.8 million. The costs consist, among other things, of advisory fees. As a result of these expenses, the EPRA Earnings of Hoivatilat for the financial year 2019 will remain below the previous guidance, to be at least 35 per cent of net sales. In addition, the company refined its estimate of the fair value of investment properties at the end of the year 2019. (Stock exchange release 27 January 2020)
Hoivatilat Plc’s extraordinary general meeting was held in Helsinki on 4 February 2020. The general meeting resolved on the remuneration and composition of the Board of Directors and the discontinuation of the Shareholders’ Nomination Board in accordance with the proposals of Aureit Holding Oy. Stefaan Gielens, Pertti Huuskonen, Ingrid Daerden, Laurence Gacoin, Reijo Tauriainen and Kari Nenonen were elected as members of the Board for the term ending at the close of the next Annual General Meeting. Stefaan Gielens was elected as Chairman of the Board, and Pertti Huuskonen was elected as Vice Chairman of the Board. (Stock exchange release 4 February 2020)
Board of Directors’ proposal for the distribution of profit
The parent company’s distributable funds stood at EUR 187.6 million at the end of the financial year. For the reason that Aureit Holding Oy owns over 98 per cent of the company’s shares and has applied for the initiation of statutory redemption proceedings the Board of Directors proposes to the Annual General Meeting that no dividend will be paid.
The 2020 Annual General Meeting will be held in June 2020.
Financial calendar for 2020
The 2019 annual report will be published during the week beginning 2 March 2020. The interim report for January–March will be published on 6 May 2020, the half-year report for January–June will be published on 19 August 2020, and the interim report for January–September will be published on 4 November 2020.
Oulu 21 February 2020
Hoivatilat Plc
Board of Directors
Further information:
Jussi Karjula, CEO, tel. +358 40 773 4054
Hoivatilat in brief:
Hoivatilat Plc specialises in building, developing, owning and leasing out nursing homes, day-care centres and service communities. Founded in 2008, Hoivatilat has been working in cooperation with as many as 60 Finnish municipalities and has launched 200 property projects throughout Finland and Sweden. www.hoivatilat.fi
EPRA key figures
| 1. EPRA Earnings and EPRA EPS, BASIC | ||||
| EUR thousand | 2019 | 2018 | ||
| Result for the period (IFRS) from the consolidated income statement | 28 244 | 37 003 | ||
| (i) Profit/loss from measuring investment properties at fair value | -24 235 | -35 627 | ||
| (ii) Gains and losses on disposal of investment properties and other non-current assets |
0 | -1 049 | ||
| (iv) Taxes based on the result for the financial year, generated by the gains and losses on disposals |
0 | 210 | ||
| (viii) Deferred tax for EPRA adjustments | 4 847 | 7 125 | ||
| EPRA Earnings | 8 856 | 7 663 | ||
| EPR Earnings per Share, EUR | 0.35 | 0.30 | ||
| 2. EPRA NAV per share and EPRA NNNAV per share | ||||
| EUR thousand | 2019 | 2018 | ||
| Equity belonging to the parent company’s shareholders | 185 249 | 161 937 | ||
| (iv) Fair value of financial instruments | 1 687 | 951 | ||
| (v.a) Deferred tax | 30 539 | 23 367 | ||
| EPRA NAV | 217 475 | 186 255 | ||
| EPRA NAV per share, EUR | 8,54 | 7,32 | ||
| EUR thousand | 2019 | 2018 | ||
| EPRA NAV | 217 475 | 186 255 | ||
| (i) Fair value of financial instruments | -1 687 | -951 | ||
| (iii) Deferred tax | -30 539 | -23 367 | ||
| EPRA NNAV | 185 249 | 161 937 | ||
| EPRA NNNAV per share, EUR | 7.27 | 6.37 | ||
| 3. EPRA vacancy rate, % | ||||
| EUR thousand | 2019 | 2018 | ||
| Annualised computational lease value for vacant premises | A | 0 | 0 | |
| Annualised computational lease value for the entire property portfolio | B | 26 179 | 21 079 | |
| EPRA vacancy rate, % | A/B | 0.0 % | 0.0 % | |
| 4. EPRA Net Initial Yield and EPRA “topped-up” NIY | ||||
| EUR Thousand | 2019 | 2018 | ||
| Investment property – wholly owned | 462 147 | 348 899 | ||
| Less: developments | -49 057 | -19 899 | ||
| Completed property portfolio | 413 090 | 329 000 | ||
| Allowance for estimated purchasers’ costs | 8 262 | 6 580 | ||
| Gross up completed property portfolio valuation (B) | B | 421 352 | 335 580 | |
| Annualised cash passing rental income | 26 179 | 21 079 | ||
| Property outgoings | -1 362 | -1 237 | ||
| Annualised net rents (A) | A | 24 817 | 19 842 | |
| Add: notional rent expiration of rent-free periods or other lease incentives | 257 | 388 | ||
| Topped-up net annualised rent (C) | C | 25 074 | 20 230 | |
| EPRA Net Initial Yield (NIY), % | A/B | 5.89 % | 5.91 % | |
| EPRA ‘topped-up’ NIY, % | C/B | 5.95 % | 6.03 % | |
|
5. EPRA cost ratios |
||||
| EUR Thousand | 2019 | 2018 | ||
| Include: | ||||
| (i) Administrative expenses* | 4 461 | 1 869 | ||
| (i) Property maintenance expenses | 1 748 | 1 307 | ||
| Exclude: | ||||
| (vii) Ground rent costs | -608 | -434 | ||
| Cost (including direct vacancy costs) | A | 5 601 | 2 743 | |
| (ix) Direct vacancy costs | 0 | |||
| Cost (excluding direct vacancy costs) | B | 5 601 | 2 743 | |
| (x) Gross Rental Income less ground rent costs – per IFRS | 22 665 | 16 749 | ||
| (xi) Less: service fee and service charge costs components of Gross Rental Income | 0 | 0 | ||
| Gross Rental Income | C | 22 665 | 16 749 | |
| EPRA Cost Ratio (including direct vacancy costs) | A/C | 24.7 % | 16.4 % | |
| EPRA Cost Ratio (excluding direct vacancy costs) | B/C | 24.7 % | 16.4 % | |
| *Salaries capitalized in investment properties have been deducted from administrative expenses. In 2019 capitalized salaries totaled 0.4 MEUR and 0.5 MEUR in 2018. Administrative expenses 2019 include EUR 1.8 million non-recurring expenses arising from the public tender offer. | ||||
Tables
This financial statements’ bulletin has been prepared in accordance with the IAS 34 standard. The
company has prepared the financial statements’ bulletin in line with the same accounting principles
as its financial statements for 2018, with the exception of amendments to standards and interpretations of standards that came into effect in 2019.
Hoivatilat Group
Income Statement
| EUR | 7-12/2019 | 7-12/2018 | 1-12/2019 | 1-12/2018 |
| TOTAL REVENUE | 12 380 103 | 9 120 834 | 23 273 181 | 17 182 305 |
| Transfers of investment properties and changes in fair value | 14 980 862 | 20 671 349 | 24 235 107 | 36 675 896 |
| Other operating income | 0 | 227 335 | 0 | 282 735 |
| Expenses of employee benefits | -2 098 341 | -1 395 255 | -3 193 101 | -2 450 190 |
| Depreciation | -98 466 | -25 266 | -170 939 | -33 795 |
| Other operating expenses | -3 502 474 | -1 168 226 | -5 413 795 | -3 176 505 |
| OPERATING PROFIT (LOSS) | 21 661 684 | 27 203 437 | 38 730 453 | 48 480 446 |
| Financial income | 6 104 | 578 | 7 718 | 867 |
| Financial expenses | -1 778 836 | -1 035 669 | -3 318 684 | -2 057 609 |
| PROFIT BEFORE TAXES | 19 888 952 | 26 168 345 | 35 419 487 | 46 423 703 |
| Taxes for the review period and previous periods | -3 942 326 | -5 348 882 | -7 175 294 | -9 420 361 |
| PROFIT FOR THE PERIOD | 15 946 625 | 20 819 463 | 28 244 193 | 37 003 342 |
| Consolidated statement of comprehensive income IFRS |
||||
| EUR | 7-12/2019 | 7-12/2018 | 1-12/2019 | 1-12/2018 |
| PROFIT FOR THE PERIOD | 15 946 625 | 20 819 463 | 28 244 193 | 37 003 342 |
| Other comprehensive income items | ||||
| Items that may be reclassified to profit or loss later: | ||||
| Translation differences | -4 638 | -1 747 | -707 | -1 747 |
| Cash flow hedging | 460 268 | -427 177 | -919 620 | -992 077 |
| Taxes associated with other comprehensive income items | -92 054 | 85 435 | 183 924 | 198 415 |
| Other comprehensive income items for the period after taxes | 363 577 | -341 741 | -736 403 | -795 409 |
| COMPREHENSIVE INCOME FOR THE PERIOD | 16 310 202 | 20 477 722 | 27 507 790 | 36 207 933 |
| Distribution of profit for the period | ||||
| To shareholders of the parent company | 15 946 625 | 20 819 463 | 28 244 193 | 37 003 342 |
| To shareholders with non-controlling interests | 0 | 0 | 0 | 0 |
| Distribution of comprehensive income for the period | ||||
| To shareholders of the parent company | 16 310 202 | 20 477 722 | 27 507 790 | 36 207 933 |
| To shareholders with non-controlling interests | 0 | 0 | 0 | 0 |
| Earnings per share calculated on the profit belonging to the parent company’s shareholders | ||||
| Undiluted earnings per share | 0.63 | 0.82 | 1.11 | 1.46 |
| Earnings per share adjusted by the dilution effect | 0.63 | 0.82 | 1.11 | 1.45 |
Hoivatilat Group
Balance sheet
| EUR | 31.12.2019 | 31.12.2018 |
| ASSETS | ||
| Non-current assets | ||
| Intangible assets | 108 872 | 150 285 |
| Investment properties | 490 790 779 | 348 899 080 |
| Machinery and equipment | 156 474 | 36 216 |
| Deferred tax assets | 590 509 | 363 778 |
| Total non-current assets | 491 646 635 | 349 449 360 |
| Current assets | ||
| Trade receivables and other receivables | 4 047 242 | 3 455 775 |
| Cash and cash equivalents | 16 223 048 | 11 382 638 |
| Total current assets | 20 270 290 | 14 838 412 |
| ASSETS TOTAL | 511 916 925 | 364 287 772 |
| EQUITY AND LIABILITIES | ||
| Equity belonging to the parent company’s shareholders |
||
| Share capital | 80 000 | 80 000 |
| Invested non-restricted equity reserve | 69 722 015 | 69 722 015 |
| Fair value reserve | -1 686 635 | -950 940 |
| Translation difference | -2 455 | -1 747 |
| Retained earnings/losses | 88 891 609 | 56 084 397 |
| Profit/loss for the period | 28 244 193 | 37 003 342 |
| Equity belonging to the parent company’s shareholders, total | 185 248 727 | 161 937 067 |
| Non-current liabilities | ||
| Lease liabilities | 27 720 371 | |
| Financial liabilities | 198 491 702 | 158 809 420 |
| Deferred tax liabilities | 30 778 602 | 23 618 863 |
| Total non-current liabilities | 257 990 675 | 182 428 283 |
| Current liabilities | ||
| Lease liabilities | 1 032 862 | |
| Financial liabilities | 59 507 410 | 11 640 147 |
| Trade payables and other liabilities | 9 137 251 | 8 282 274 |
| Total current liabilities | 69 677 523 | 19 922 422 |
| Total liabilities | 326 688 198 | 202 350 705 |
| EQUITY AND LIABILITIES TOTAL | 511 916 925 | 364 287 772 |
Hoivatilat Group
Cash flow statement
| EUR | 7-12/2019 | 7-12/2018 | 1-12/2019 | 1-12/2018 | ||
| Cash flow from operations | ||||||
| Profit for the financial year | 15 946 625 | 21 046 798 | 28 244 193 | 37 003 342 | ||
| Adjustments | ||||||
| Non-cash transactions and other adjustments | -14 471 101 | -21 018 166 | -23 345 326 | -37 435 762 | ||
| Interest and other financial expenses | 1 778 836 | 1 035 669 | 3 318 684 | 2 057 609 | ||
| Interest income | -6 104 | -578 | -7 718 | -867 | ||
| Taxes | 3 942 326 | 5 616 782 | 7 175 294 | 9 420 361 | ||
| Changes in working capital | ||||||
| Change in trade receivables and other receivables | 161 333 | -1 624 046 | -592 174 | -2 726 708 | ||
| Change in trade payables and other liabilities | 247 685 | 5 733 543 | -694 314 | 4 086 318 | ||
| Interest paid | -1 954 280 | -1 048 502 | -3 436 324 | -2 062 160 | ||
| Interest received | 6 104 | 578 | 7 718 | 867 | ||
| Taxes paid | 1 508 909 | -1 534 806 | 1 367 295 | -1 611 666 | ||
| Net cash flow from operations (A) | 7 160 335 | 8 207 272 | 12 037 328 | 8 731 334 | ||
| Cash flow from investment activities | ||||||
| Divestment of investment properties | 0 | 10 911 237 | 0 | 10 911 237 | ||
| Acquisition of investment properties | 262 037 | 0 | -1 372 799 | -2 126 892 | ||
| Investments in property, plant and equipment | -45 354 926 | -44 532 450 | -88 224 035 | -77 193 637 | ||
| Investments in intangible assets | -41 452 | -92 178 | -21 469 | -136 269 | ||
| Net cash flow from investment activities (B) | -46 134 340 | -33 713 391 | -89 618 302 | -68 545 562 | ||
| Cash flow from financing activities | ||||||
| Payments from the share issue | 0 | 0 | 0 | 1 504 | ||
| Loan withdrawals | 54 569 812 | 36 823 088 | 98 732 685 | 73 413 983 | ||
| Loan repayments | -6 055 335 | -4 450 492 | -11 990 564 | -8 756 467 | ||
| Dividends paid | 0 | 0 | -4 320 736 | -3 307 100 | ||
| Cash flow from financing activities (C) | 48 514 477 | 32 372 596 | 82 421 385 | 61 351 920 | ||
| Change in cash and cash equivalents (A + B + C) | 9 540 472 | 6 866 477 | 4 840 411 | 1 537 693 | ||
| Cash and cash equivalents at the beginning of the financial year | 6 682 577 | 4 516 160 | 11 382 638 | 9 844 945 | ||
| Cash and cash equivalents at the end of the review period* | 16 223 048 | 11 382 638 | 16 223 048 | 11 382 638 | ||
Hoivatilat Group
Calculation of changes in equity
| Equity belonging to the parent company’s shareholders | ||||||
| EUR | Share capital |
Invested non-restricted equity reserve |
Fair value reserve |
Translation difference |
Retained earnings |
Equity, total |
| Equity on 1 Jan 2018 | 80 000 | 69 720 511 | -157 278 | 0 | 59 946 662 | 129 589 896 |
| Comprehensive income | ||||||
| Profit for the financial year | 37 003 342 | 37 003 342 | ||||
| Other comprehensive income items* |
||||||
| Translation difference | -1 747 | -1 747 | ||||
| Cash flow hedging | -793 662 | -793 662 | ||||
| Total comprehensive income for the review period | -793 662 | -1 747 | 37 003 342 | 36 207 933 | ||
| Transactions with shareholders | ||||||
| Distribution of dividends | -3 307 100 | -3 307 100 | ||||
| Share issue | 1 504 | 1 504 | ||||
| Incentive scheme | -555 165 | -555 165 | ||||
| Transactions with shareholders, total | 0 | 1 504 | -3 862 265 | -3 860 761 | ||
| Equity on 31 Dec 2018 | 80 000 | 69 722 015 | -950 940 | -1 747 | 93 087 739 | 161 937 067 |
| Equity on 1 Jan 2019 | 80 000 | 69 722 015 | -950 940 | -1 747 | 93 087 739 | 161 937 067 |
| Comprehensive income | ||||||
| Profit for the financial year | 28 244 193 | 28 244 193 | ||||
| Other comprehensive income items* | ||||||
| Translation difference | -707 | -707 | ||||
| Cash flow hedging | -735 696 | -735 696 | ||||
| Total comprehensive income for the review period |
-735 696 | -707 | 28 244 193 | 27 507 790 | ||
| Transactions with shareholders | ||||||
| Distribution of dividends | -4 320 736 | -4 320 736 | ||||
| Incentive scheme | 124 606 | 124 606 | ||||
| Transactions with shareholders, total | -4 196 130 | -4 196 130 | ||||
| Equity on 31 Dec 2019 | 80 000 | 69 722 015 | -1 686 635 | -2 455 | 117 135 801 | 185 248 727 |
| * Items that may be reclassified to profit or loss later. | ||||||
Hoivatilat Group
Key figures
| Group | Group | |
| 31 Dec 2019 | 31 Dec 2018 | |
| Total revenue (EUR thousand) | 23 273 | 17 182 |
| Operating profit (EUR thousand) | 38 730 | 48 480 |
| Profit for the financial year (EUR thousand) | 28 244 | 37 003 |
| EPRA Earnings (EUR thousand) | 8 856 | 7 663 |
| Balance sheet total (EUR thousand) | 511 986 | 364 288 |
| EPRA NAV (EUR thousand) | 217 258 | 186 255 |
| EPRA NNAV (EUR thousand) | 185 249 | 161 937 |
| Equity ratio (%) | 36.2 | 44.5 |
| Loan-to-value (LTV) (%) | 52.3 | 45.6 |
| Gearing ratio (%) | 146.0 | 98.2 |
| Return on equity (%) | 16.3 | 25.4 |
| Earnings per share, undiluted (EUR) | 1.11 | 1.46 |
| Earnings per share, diluted (EUR) | 1.11 | 1.45 |
| Dividend per share (EUR) | 0.00* | 0.17 |
| EPRA Earnings Per Share, (EUR, EPRA EPS) | 0.35 | 0.30 |
| EPRA NAV per share (EUR) | 8.54 | 7.28 |
| EPRA NNNAV per share (EUR) | 7.27 | 6.37 |
| Net return (imputed) (%) | 6.03 | 6.15 |
| Value of the lease portfolio* (EUR thousand) | 584 139 | 426 953 |
| Average maturity of the lease portfolio (years) | 15.8 | 14.9 |
| Economic occupancy rate (%) | 100 | 100 |
| EPRA vacancy rate (%) | 0 | 0 |
| Number of shares adjusted for share issues at the end of the period | 25 479 495 | 25 439 229 |
| Average number of shares adjusted for share issues during the period |
25 428 346 | 25 414 511 |
| Average number of shares adjusted for share issues during the period, diluted |
25 428 346 | 25 491 042 |
| Number of employees at the end of the period | 25 | 19 |
| Average number of personnel during the period | 20 | 17 |
| * Proposal of the Board of Directors | ||
| ** Future rental cash flow from the company’s leases and preliminary agreements without index increases | ||
Investment properties
The investment properties owned by the company are measured at fair value after their initial recognition. Properties with low completion rates are measured at acquisition cost. The fair value of properties has been determined by a third-party expert, Realia Management Oy, an authorised provider of valuation services. The statement issued by Realia Management on the estimated fair value of the investment properties on 31 December 2019 is available on the Hoivatilat website. The value of investment properties at the end of the review period was EUR 490.8 (348.9) million, including the value of building plots recognised as right-of-use assets in accordance with IFRS 16. Of the total value, completed properties represented EUR 413.1 (329.0) million, properties under construction represented EUR 48.0 (18.4) million, and properties measured at acquisition cost due to their low level of completion represented EUR 1.1 (1.5) million. The value of building plots recognised as right-of-use assets in accordance with IFRS 16 was EUR 28.6 (0.0) million.
| 2019 | 2018 | |||||||||
| Fair value of investment properties, 1 Jan | 348 899 080 | 247 066 462 | ||||||||
| Investments in properties under construction and in the starting phase | 83 673 162 | 79 783 106 | ||||||||
| Other investment property investments | 993 333 | 289 099 | ||||||||
| Additions from purchased propeties | 3 791 849 | 1 379 446 | ||||||||
| Deductions from divestments | 0 | -15 245 660 | ||||||||
| Profits and losses from changes in fair value | 24 789 849 | 35 626 628 | ||||||||
| Building plots recognized as right-of-use assets in accordance with IFRS 16 | 28 643 506 | 0 | ||||||||
| Fair value of investment properties, 31 Dec | 490 790 779 | 348 899 080 | ||||||||
| 2019 | 2018 | |||||||||
| Completed investment properties | 413 090 000 | 329 000 000 | ||||||||
| Investment properties under construction | 47 974 832 | 18 360 223 | ||||||||
| Investment properties in the starting phase (valued at acquisition cost) | 1 082 441 | 1 538 857 | ||||||||
| Building plots recognized as right-of-use assets in accordance with IFRS 16 | 28 643 506 | 0 | ||||||||
| Total | 490 790 779 | 348 899 080 | ||||||||
On 31 December 2019, the company had a contractual obligation to complete the investment properties that are under construction or in the start-up phase. The fulfilment of these obligations requires that the Group invest an acquisition cost amount of around EUR 154.4 (105.1) million in the properties.
| Contingent liabilities | 31.12.2019 | 31.12.2018 | |
| Property mortgages | |||
| Loans from financial institutions | 241 752 346 | 170 449 567 | |
| Mortgages provided | 281 224 413 | 228 364 213 | |
| Mortgages total | 281 224 413 | 228 364 213 | |
| Pledged property shares | |||
| Pledged investment properties | 333 186 040 | 244 584 100 | |
| Pledges total | 333 186 040 | 244 584 100 | |
| Refund obligation related to value added tax on property investments
|
|||
| VAT refund obligation | 3 483 224 | 2 636 750 | |
| Interest rate swaps | |||
| Nominal value | 76 000 000 | 61 000 000 | |
| Fair value | -2 108 294 | -1 188 674 | |
Business transactions with external related party companies
Timo Pekkarinen, member of the Board of Directors until 26 March 2019, is the Managing Director of Lapti Group, the parent company of Rakennusliike Lapti Oy. As of 26 March 2019, Rakennusliike Lapti Oy is no longer regarded as a related party of Hoivatilat Plc. Rakennusliike Lapti Oy’s invoicing was EUR 3.6 million during the first three months of financial year and EUR 6.2 million during the 2018 financial year.
New and amended standards and other changes in accounting principles applied during the period
IFRS 16 Leases replaced IAS 17 from the beginning of the 2019 financial period. The standard provided reporting organisations with instructions concerning the method of treating leases in the lessee’s financial statements, changed the definition of leasing and determined the principles for recognising leases on the balance sheet both as a right-of-use asset and as a lease liability. The adoption of the standard did not cause any changes for Hoivatilat regarding the accounting treatment of leases where the Group acts as a lessor. Right-of-use assets have been recognised under the balance sheet items ‘Investment properties’ and ‘Machinery and equipment’ for the leases covered by the standard. The right-of-use assets recognised under ‘Investment properties’ consist of Hoivatilat Group’s leasehold land agreements. The right-of-use assets recognised under ‘Machinery and equipment’ were mainly recognised for lease agreements included in administrative expenses, such as office leases and leased vehicles. The Group’s lease liability was measured by discounting the lease liabilities covered by the standard to their present values using the company management’s view of the interest rate for additional credit at the time the leases started. The expenses for land area leases were recognised on the income statement as part of the change in the fair value of investment properties (comparable to straight-line depreciation) as financial expenses based on the interest rate factor determined for the lease liability. For the right-of-use assets presented under ‘Machinery and equipment’, the impact on income is presented in financial expenses and as an amortisation item. Regarding the adoption of IFRS 16 Leases, Hoivatilat has applied a simplified approach and has therefore not adjusted the details of the review period used for comparison. In addition, Hoivatilat has applied the practical reliefs permitted by the standard and has therefore not applied the standard to leases of less than one year or leases of minor value. These include leases of certain pieces of office equipment, for example.
Impact of the implementation of IFRS 16 on reporting
The standard had the following impacts on the Group’s reporting for the review period:
| Income statement | 1-12/2019 |
| Changes in the fair value of investment properties | -494 474 |
| Depreciation | -100 941 |
| Other operating expenses | 896 387 |
| Operating profit | 300 972 |
| Financial expenses | -399 172 |
| Profit before taxes | -98 201 |
| Deferred taxes | 19 640 |
| Result for the period | -78 561 |
| EPRA Earnings | 317 019 |
| Balance sheet | Investment properties | Machinery and equipment |
Total right-of-use assets |
Lease liabilities |
| 1.1.2019 | 26 191 178 | 129 124 | 26 320 303 | 26 320 303 |
| 31.12.2019 | 28 643 506 | 108 548 | 28 752 054 | 28 753 233 |
Changes to the calculation of key figures
In the calculation of the loan-to-value (LTV) ratio, right-of-use assets and lease liabilities related to these right-of-use assets that are presented as part of investment properties in accordance with IFRS 16 have not been considered. Therefore, IFRS 16 has no impact on LTV calculations compared with the corresponding period in the previous year. Updated formula:
| Loan-to-value (LTV), % = | Financial liabilities − lease liabilities (IFRS 16) − cash and cash equivalents | × 100 |
| Fair value of investment properties − right-of-use assets classified as investment properties (IFRS 16) |
Calculation formulas for key figures (other than EPRA key figures)
| Earnings per share (EPS), undiluted, EUR = | Profit for the period belonging to the parent company’s shareholders | ||||
| Weighted average of the number of shares in the review period | |||||
| Earnings per share (EPS), diluted, EUR = | Profit for the period belonging to the parent company’s shareholders | ||||
| Weighted average of the number of shares in the review period, adjusted for the dilution effect | |||||
| Dividend per share, EUR = | Dividend paid for the financial year | ||||
| Number of shares entitled to dividend | |||||
| Calculation formulas for key figures (alternative key figures) | |||||
| Equity ratio, % = | Equity | *100 | |||
| Balance sheet total − advances received | |||||
| Net gearing, % = | Interest-bearing liabilities − cash in hand and at banks | *100 | |||
| Equity | |||||
| Return on equity, % = | Profit/loss for the financial year | *100 | |||
| Average equity during the financial year | |||||
| Economic occupancy rate, % = | Gross rents for the review period / number of months | *100 | |||
| Potential gross rents / number of months | |||||
| Annualised rental income for the month of the financial statements − the forecast 12-month expenses of the properties in question | |||||
| Net return (imputed), % = | *100 | ||||
| Value of the investment properties generating rental cash flow for the month of the financial statements | |||||
| Loan-to-value (LTV), % = | Financial liabilities − cash and cash equivalents | *100 | |||
| Fair value of investment properties | |||||
| Reconciliation calculations for certain key figures | |||||
| Net return (imputed), % | |||||
| EUR thousand | 31.12.2019 | 31.12.2018 | |||
| Annualised rental income for the month of the financial statements | 26 269 | 21 467 | |||
| Predicted expenses for 12 months for properties generating rental income | -1 362 | -1 237 | |||
| Net rental income | 24 907 | 20 230 | |||
| Value of the investment properties generating rental cash flow for the month of the financial statements | 413 090 | 329 000 | |||
| Net return (imputed), % | 6.03 % | 6.15 % | |||