• Latest
  • Trending
  • All
International container volume, shipping rates highlight weakness in imports from China

International container volume, shipping rates highlight weakness in imports from China

March 1, 2020
Last Mile Delivery Market Worth Observing Growth | UPS, FedEx, SF Express

Last Mile Delivery Market Worth Observing Growth | UPS, FedEx, SF Express

April 23, 2024
Top 5 Spend Analysis Software ranked in 2024

Top 5 Spend Analysis Software ranked in 2024

March 1, 2024
How Tesla And BMW Are Leading A Supply Chain Renaissance With Blockchain

How Tesla And BMW Are Leading A Supply Chain Renaissance With Blockchain

January 19, 2024
LATAM Cargo strengthens European cargo links

LATAM Cargo strengthens European cargo links

April 14, 2020
Ford making reusable hospital gowns from airbag materials as efforts against coronavirus expand

Ford making reusable hospital gowns from airbag materials as efforts against coronavirus expand

April 14, 2020
Don’t Sweat NBC’s Decision to Cut Back on Television Ad Inventory

Don’t Sweat NBC’s Decision to Cut Back on Television Ad Inventory

April 14, 2020
Software firms sharpen focus on AI, big data as IT spending drops

Software firms sharpen focus on AI, big data as IT spending drops

April 14, 2020
Navigating turbulent times in your supply chain (TL:DR version)

Navigating turbulent times in your supply chain (TL:DR version)

April 14, 2020
Last Mile Delivery by Drones Market is Booming Worldwide

Last Mile Delivery by Drones Market is Booming Worldwide

April 14, 2020
AIR CARGO MARKET SIZE, SHARE, DEMAND, TREND, LATEST INNOVATIONS & APPLICATION ANALYSIS AND INDUSTRY GROWTH FORECAST 2027 – Science In Me

AIR CARGO MARKET SIZE, SHARE, DEMAND, TREND, LATEST INNOVATIONS & APPLICATION ANALYSIS AND INDUSTRY GROWTH FORECAST 2027 – Science In Me

April 14, 2020
Wheat procurement in Patiala: 6,500 coupons issued to farmers – cities

Wheat procurement in Patiala: 6,500 coupons issued to farmers – cities

April 14, 2020
Pandemic, Plastics And The Continuing Quest For Sustainability

Pandemic, Plastics And The Continuing Quest For Sustainability

April 14, 2020
  • Supply Chain
  • Logistics
  • Warehousing
  • Procurement
  • Shipping
  • More
    • Strategic Sourcing
    • Spend Analysis
    • Inventory
    • Contact Us
No Result
View All Result
United States International Supply Chain Commission
Home Shipping

International container volume, shipping rates highlight weakness in imports from China

by usiscc
March 1, 2020
in Shipping
0
International container volume, shipping rates highlight weakness in imports from China
492
SHARES
1.4k
VIEWS
Share on FacebookShare on Twitter

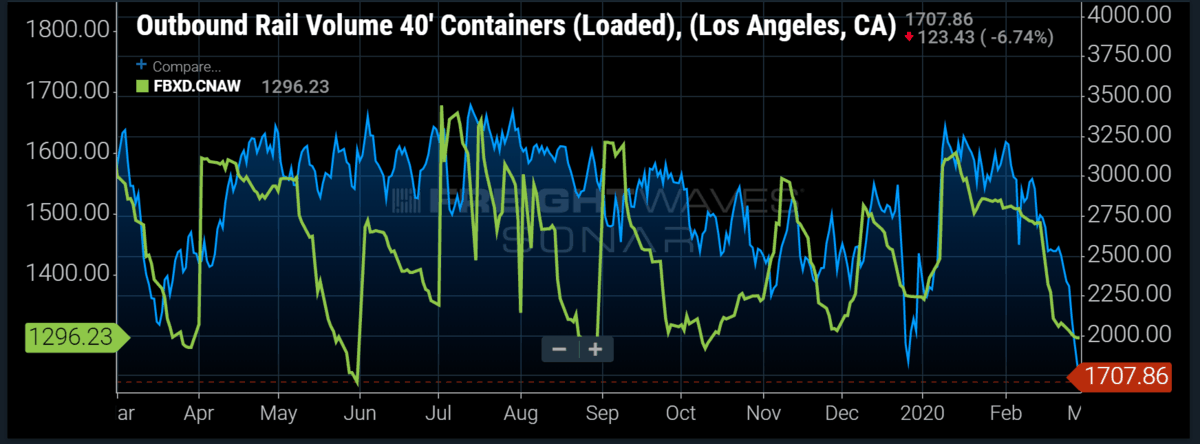
Chart of the Week:  Outbound volume of 40-foot loaded containers from Los Angeles versus the Freightos Baltic Daily Index from China to the U.S. West Coast  SONAR:  ORAIL40L.LAX, FBXD.CNAW

Following one of the worst weeks in the stock market, questions about the impact of the coronavirus on supply chains abound. Will there be shortages of imported goods as a result of extended Chinese factory shutdowns? Will Chinese factories reopen following Chinese New Year closures only to find labor shortages from workers who elect not to return? Will there be shortages of products manufactured outside of Asia because of missing Chinese-made components? Will we have a consumer-driven recession as Westerners pull back on spending after seeing their equity portfolios collapse and in light of their newfound aversion to travel? Are economies around the world so intertwined that a recession in China (whether the Chinese government admits to it or not) makes a global recession inevitable?

While the supply and production issues have been concerns for several weeks, what’s changed in the past week is that the world’s consumption centers, not just the world’s manufacturing center, are feeling ill. There could simultaneously be a shortage of goods and consumers with little interest in buying — not great for freight demand.

The SONAR chart above illustrates the latest declines in outbound 40-foot loaded container volume from the LA port complex (includes Long Beach) as well as the decline in the Freightos Baltic Daily Index from China to the U.S. West Coast. We consider those data series among the best indexes to monitor the ongoing impact of the coronavirus because they are daily (ORAIL uses a seven-day moving average) and are heavily weighted toward goods manufactured in China for U.S. consumption.

Outbound loaded container volume fell from around 3,200 per day to an average of 1,831 per day during the past seven days, and that data series hasn’t yet found a bottom. Meanwhile, the Freightos Baltic Daily Index from China to the U.S. West Coast declined from nearly $1,600 per 40-foot container to just under $1,300. We attribute the greater percentage drop in the Freightos Index since January (44% versus 19%) to the reduction in ocean shipping capacity which has provided some degree of support for rates.

The challenge is deciphering how much of the declines in those indices is related to abnormal factory shutdowns and blank sailings versus normal seasonality. Last year, same indexes fell in nearly similar manner with outbound international containers from LA falling from an average of 3,250 containers a day level to just over 2,000. Adding to the noise, early 2019 was abnormal because there was a pull-forward of imports from 2019 to 2018 to avoid tariffs that went into effect at the beginning of last year. With that background, we consider the drop in outbound 40-foot loaded container volume from LA to below last year’s Chinese New Year level to be significant, and it could presage a further drop and/or a lack of a rebound in March and April like we saw last year.

About the Chart of the Week

The FreightWaves Chart of the Week is a chart selection from SONAR that provides an interesting data point to describe the state of the freight markets. A chart is chosen from thousands of potential charts on SONAR to help participants visualize the freight market in real-time. Each week a Market Expert will post a chart, along with commentary live on the front-page. After that, the Chart of the Week will be archived on FreightWaves.com for future reference.

SONAR aggregates data from hundreds of sources, presenting the data in charts and maps and providing commentary on what freight market experts want to know about the industry in real time.

The FreightWaves data science and product teams are releasing new data sets each week and enhancing the client experience.

To request a SONAR demo click here.

Share197Tweet123
usiscc

usiscc

  • Trending
  • Comments
  • Latest
Escape From Tarkov – How to Rotate Items

Escape From Tarkov – How to Rotate Items

February 5, 2020
Supply chain examination: Planning for vulnerabilities you can’t control

Supply chain examination: Planning for vulnerabilities you can’t control

December 7, 2019
Procurement Project Manager job with Camden London Borough Council

Procurement Project Manager job with Camden London Borough Council

February 17, 2020
Art Battle Wichita Falls III at The Warehouse, 1401 Lamar.

Art Battle Wichita Falls III at The Warehouse, 1401 Lamar.

0
Global Industry Analysis, Size, Share, Growth, Trends, and Forecasts 2016–2024 – ZMR News Reports

Global Industry Analysis, Size, Share, Growth, Trends, and Forecasts 2016–2024 – ZMR News Reports

0
PHOTOS: Ottawa firefighters respond to warehouse fire

PHOTOS: Ottawa firefighters respond to warehouse fire

0
Last Mile Delivery Market Worth Observing Growth | UPS, FedEx, SF Express

Last Mile Delivery Market Worth Observing Growth | UPS, FedEx, SF Express

April 23, 2024
Top 5 Spend Analysis Software ranked in 2024

Top 5 Spend Analysis Software ranked in 2024

March 1, 2024
How Tesla And BMW Are Leading A Supply Chain Renaissance With Blockchain

How Tesla And BMW Are Leading A Supply Chain Renaissance With Blockchain

January 19, 2024
  • Privacy Policy
  • Terms of Use
  • Disclaimer
  • DMCA
  • Contact Us

Copyright © 2024 United States International Supply Chain Commission (usiscc.org)

This website uses cookies to improve your experience. We'll assume you're ok with this, but you can opt-out if you wish. Cookie settingsACCEPT
Privacy & Cookies Policy

Privacy Overview

This website uses cookies to improve your experience while you navigate through the website. Out of these cookies, the cookies that are categorized as necessary are stored on your browser as they are essential for the working of basic functionalities of the website. We also use third-party cookies that help us analyze and understand how you use this website. These cookies will be stored in your browser only with your consent. You also have the option to opt-out of these cookies. But opting out of some of these cookies may have an effect on your browsing experience.
Necessary
Always Enabled

Necessary cookies are absolutely essential for the website to function properly. This category only includes cookies that ensures basic functionalities and security features of the website. These cookies do not store any personal information.

Non-necessary

Any cookies that may not be particularly necessary for the website to function and is used specifically to collect user personal data via analytics, ads, other embedded contents are termed as non-necessary cookies. It is mandatory to procure user consent prior to running these cookies on your website.

SAVE & ACCEPT
No Result
View All Result
  • Supply Chain
  • Logistics
  • Warehousing
  • Procurement
  • Shipping
  • More
    • Strategic Sourcing
    • Spend Analysis
    • Inventory
    • Contact Us

Copyright © 2024 United States International Supply Chain Commission (usiscc.org)