


David Iben put it well when he said, ‘Volatility is not a risk we care about. What we care about is avoiding the permanent loss of capital. So it might be obvious that you need to consider debt, when you think about how risky any given stock is, because too much debt can sink a company. We can see that The Warehouse Group Limited (NZSE:WHS) does use debt in its business. But should shareholders be worried about its use of debt?
What Risk Does Debt Bring?
Debt and other liabilities become risky for a business when it cannot easily fulfill those obligations, either with free cash flow or by raising capital at an attractive price. If things get really bad, the lenders can take control of the business. However, a more frequent (but still costly) occurrence is where a company must issue shares at bargain-basement prices, permanently diluting shareholders, just to shore up its balance sheet. Of course, plenty of companies use debt to fund growth, without any negative consequences. The first step when considering a company’s debt levels is to consider its cash and debt together.
Check out our latest analysis for Warehouse Group
How Much Debt Does Warehouse Group Carry?
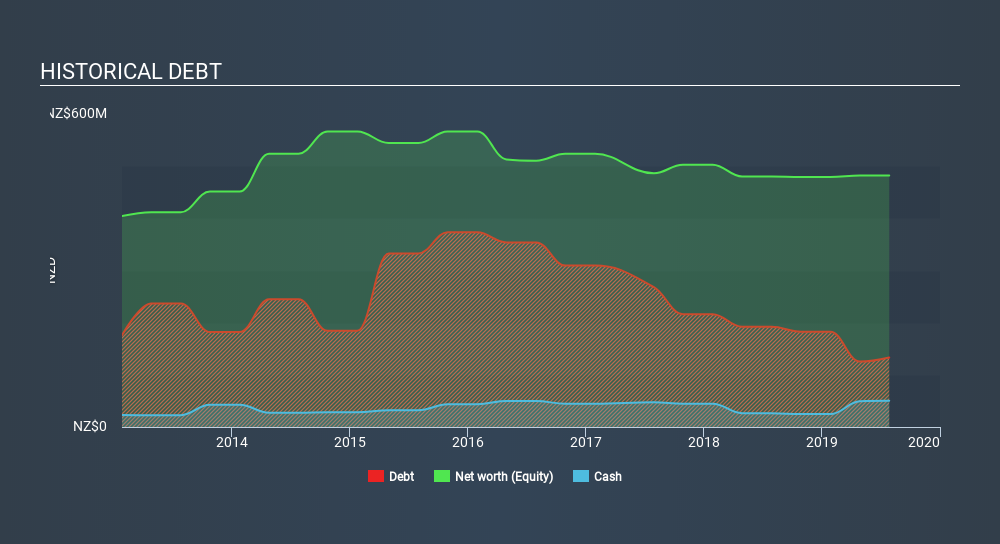
You can click the graphic below for the historical numbers, but it shows that Warehouse Group had NZ$133.4m of debt in July 2019, down from NZ$192.2m, one year before. However, it also had NZ$50.2m in cash, and so its net debt is NZ$83.2m.
A Look At Warehouse Group’s Liabilities
The latest balance sheet data shows that Warehouse Group had liabilities of NZ$540.5m due within a year, and liabilities of NZ$28.3m falling due after that. Offsetting this, it had NZ$50.2m in cash and NZ$77.2m in receivables that were due within 12 months. So its liabilities outweigh the sum of its cash and (near-term) receivables by NZ$441.4m.
Warehouse Group has a market capitalization of NZ$973.7m, so it could very likely raise cash to ameliorate its balance sheet, if the need arose. But we definitely want to keep our eyes open to indications that its debt is bringing too much risk.
We use two main ratios to inform us about debt levels relative to earnings. The first is net debt divided by earnings before interest, tax, depreciation, and amortization (EBITDA), while the second is how many times its earnings before interest and tax (EBIT) covers its interest expense (or its interest cover, for short). The advantage of this approach is that we take into account both the absolute quantum of debt (with net debt to EBITDA) and the actual interest expenses associated with that debt (with its interest cover ratio).
Warehouse Group has a low net debt to EBITDA ratio of only 0.51. And its EBIT easily covers its interest expense, being 12.8 times the size. So you could argue it is no more threatened by its debt than an elephant is by a mouse. Also positive, Warehouse Group grew its EBIT by 24% in the last year, and that should make it easier to pay down debt, going forward. There’s no doubt that we learn most about debt from the balance sheet. But ultimately, every company can contain risks that exist outside of the balance sheet. For example, we’ve discovered 1 warning sign for Warehouse Group which any shareholder or potential investor should be aware of.
Finally, a business needs free cash flow to pay off debt; accounting profits just don’t cut it. So we always check how much of that EBIT is translated into free cash flow. During the last three years, Warehouse Group produced sturdy free cash flow equating to 74% of its EBIT, about what we’d expect. This free cash flow puts the company in a good position to pay down debt, when appropriate.
Our View
Warehouse Group’s interest cover suggests it can handle its debt as easily as Cristiano Ronaldo could score a goal against an under 14’s goalkeeper. But truth be told we feel its level of total liabilities does undermine this impression a bit. Zooming out, Warehouse Group seems to use debt quite reasonably; and that gets the nod from us. After all, sensible leverage can boost returns on equity. Given Warehouse Group has a strong balance sheet is profitable and pays a dividend, it would be good to know how fast its dividends are growing, if at all. You can find out instantly by clicking this link.
If you’re interested in investing in businesses that can grow profits without the burden of debt, then check out this free list of growing businesses that have net cash on the balance sheet.
If you spot an error that warrants correction, please contact the editor at [email protected]. This article by Simply Wall St is general in nature. It does not constitute a recommendation to buy or sell any stock, and does not take account of your objectives, or your financial situation. Simply Wall St has no position in the stocks mentioned.
We aim to bring you long-term focused research analysis driven by fundamental data. Note that our analysis may not factor in the latest price-sensitive company announcements or qualitative material. Thank you for reading.
Discounted cash flow calculation for every stock
Simply Wall St does a detailed discounted cash flow calculation every 6 hours for every stock on the market, so if you want to find the intrinsic value of any company just search here. It’s FREE.