• Latest
  • Trending
  • All
Phoenix home sales skyrocket nearly 20% in January

Phoenix home sales up 14% year-over-year

March 18, 2020
Last Mile Delivery Market Worth Observing Growth | UPS, FedEx, SF Express

Last Mile Delivery Market Worth Observing Growth | UPS, FedEx, SF Express

April 23, 2024
Top 5 Spend Analysis Software ranked in 2024

Top 5 Spend Analysis Software ranked in 2024

March 1, 2024
How Tesla And BMW Are Leading A Supply Chain Renaissance With Blockchain

How Tesla And BMW Are Leading A Supply Chain Renaissance With Blockchain

January 19, 2024
LATAM Cargo strengthens European cargo links

LATAM Cargo strengthens European cargo links

April 14, 2020
Ford making reusable hospital gowns from airbag materials as efforts against coronavirus expand

Ford making reusable hospital gowns from airbag materials as efforts against coronavirus expand

April 14, 2020
Don’t Sweat NBC’s Decision to Cut Back on Television Ad Inventory

Don’t Sweat NBC’s Decision to Cut Back on Television Ad Inventory

April 14, 2020
Software firms sharpen focus on AI, big data as IT spending drops

Software firms sharpen focus on AI, big data as IT spending drops

April 14, 2020
Navigating turbulent times in your supply chain (TL:DR version)

Navigating turbulent times in your supply chain (TL:DR version)

April 14, 2020
Last Mile Delivery by Drones Market is Booming Worldwide

Last Mile Delivery by Drones Market is Booming Worldwide

April 14, 2020
AIR CARGO MARKET SIZE, SHARE, DEMAND, TREND, LATEST INNOVATIONS & APPLICATION ANALYSIS AND INDUSTRY GROWTH FORECAST 2027 – Science In Me

AIR CARGO MARKET SIZE, SHARE, DEMAND, TREND, LATEST INNOVATIONS & APPLICATION ANALYSIS AND INDUSTRY GROWTH FORECAST 2027 – Science In Me

April 14, 2020
Wheat procurement in Patiala: 6,500 coupons issued to farmers – cities

Wheat procurement in Patiala: 6,500 coupons issued to farmers – cities

April 14, 2020
Pandemic, Plastics And The Continuing Quest For Sustainability

Pandemic, Plastics And The Continuing Quest For Sustainability

April 14, 2020
  • Supply Chain
  • Logistics
  • Warehousing
  • Procurement
  • Shipping
  • More
    • Strategic Sourcing
    • Spend Analysis
    • Inventory
    • Contact Us
No Result
View All Result
United States International Supply Chain Commission
Home Inventory

Phoenix home sales up 14% year-over-year

by usiscc
March 18, 2020
in Inventory
0
Phoenix home sales skyrocket nearly 20% in January
492
SHARES
1.4k
VIEWS
Share on FacebookShare on Twitter

“Strong February home sales and limited inventory defined U.S. housing ahead of the challenges brought on by the coronavirus emergency,” said Adam Contos, CEO of RE/MAX Holdings, Inc. “Even as we all adjust to the new landscape of social distancing and limited in-person interaction, houses will continue to be bought and sold. Overall, demand in February was high, inventory remains low, and interest rates are attractive, but exact circumstances vary by community. Professional agents – the local experts – can offer tremendous value right now, providing clarity and expert guidance in an environment that’s new for everyone and changing every day.”

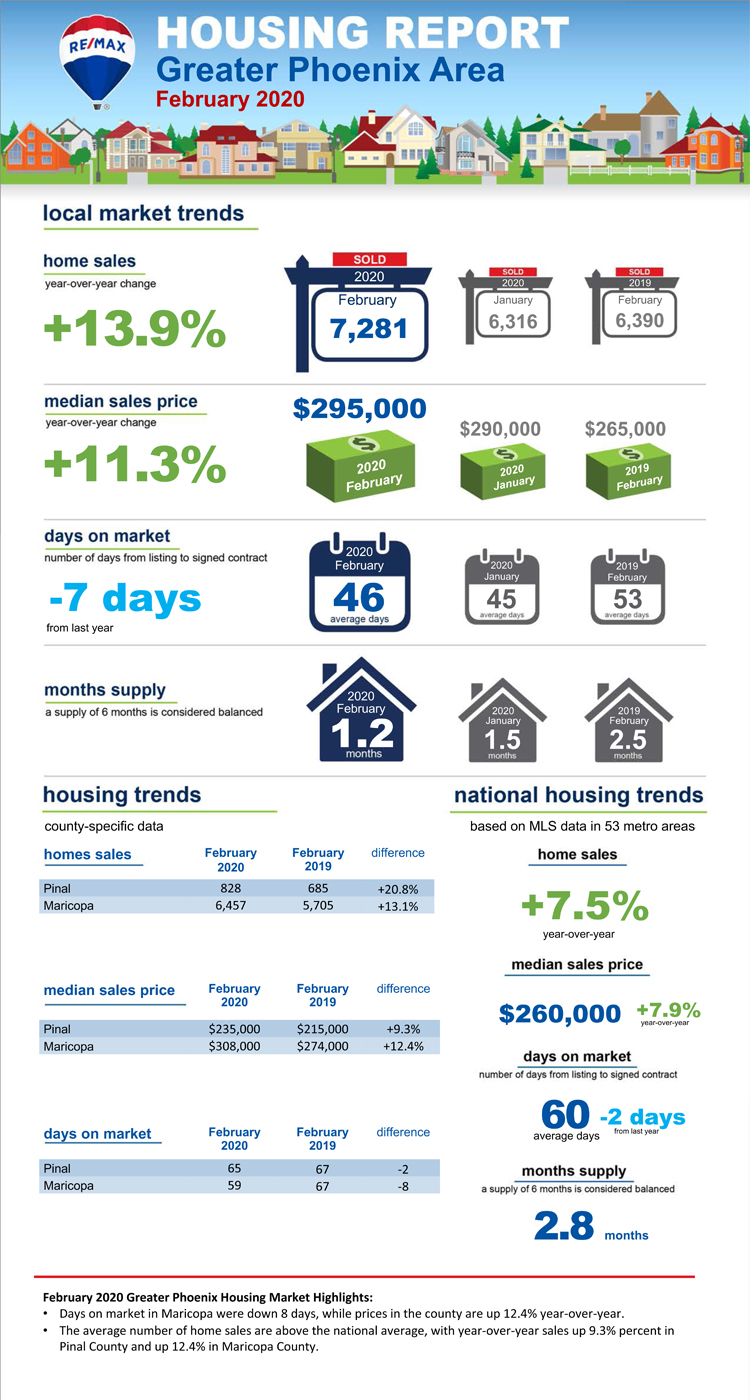
Before the coronavirus struck the U.S. on a large scale, home sales in February – which enjoyed an extra weekend day for Leap Year – increased 7.5% year over year, following strong increases of 13.5% and 10.5% in December and January. The previous streak of increasing year-over-year sales of three months or longer began in December 2015 and continued seven months into June 2016. That was also a period of large inventory declines, like the current stretch of year-over-year drops in inventory that is now at eight months.

February’s Median Sales Price of $260,000 posted a year-over-year increase of 7.9% – the 14th consecutive month where home prices have shot up.

In the nearly 12-year history of the report, three February records were set last month:

• Fewest Months Supply of Inventory: 2.8

• Fewest Days on Market: 60

• Highest Median Sales Price: $260,000

Closed Transactions

Of the 53 metro areas surveyed in February 2020, the overall average number of home sales is up 7.4% compared to January 2020, and up 7.5% compared to February 2019.  Leading the year-over-year sales percentage increase were Los Angeles, CA at +32.2%, Las Vegas, NV at +28.0%, and Billings, MT at +20.1%.

Median Sales Price – Median of 53 metro median prices

In February 2020, the median of all 53 metro Median Sales Prices was $260,000, up 2.0% from January 2020, and up 7.9% from February 2019. Fifteen metro areas increased year-over-year by double-digit percentages, with the largest increases seen in Birmingham, AL at +16.5%, Augusta, ME at +14.5%, and Milwaukee, WI at +13.9%. Three metro areas saw a year-over-year decrease in Median Sales Price, with the largest decrease seen in Billings, MT at -5.2%.

Days on Market – Average of 53 metro areas

The average Days on Market for homes sold in February 2020 was 60, up one day from the average in January 2020, and down two days from the average in February 2019. The metro areas with the lowest Days on Market were Omaha, NE at 28, and a two-way tie between Nashville, TN and San Francisco, CA at 34. The highest Days on Market averages were in Des Moines, IA at 119, Augusta, ME at 112, and Hartford, CT at 97. Days on Market is the number of days between when a home is first listed in an MLS and a sales contract is signed.

Months Supply of Inventory – Average of 53 metro areas

The number of homes for sale in February 2020 was down 2.6% from January 2020 and down 15.8% from February 2019. Based on the rate of home sales in February 2020, the Months Supply of Inventory decreased to 2.8 compared to 3.2 in January 2020, and decreased compared to 4.1 in February 2019. A six months supply indicates a market balanced equally between buyers and sellers. In February 2020, of the 53 metro areas surveyed, four metro areas reported a month’s supply at or over six, which is typically considered a buyer’s market. The markets with the lowest Months Supply of Inventory were Denver, CO and Seattle, WA, both at 1.1, and a four-way tie at 1.2.


Share197Tweet123
usiscc

usiscc

  • Trending
  • Comments
  • Latest
‘Significant opportunity’ in Asia as supply chain integrates, consolidates

‘Significant opportunity’ in Asia as supply chain integrates, consolidates

January 3, 2020
Last Mile Delivery Market Worth Observing Growth | UPS, FedEx, SF Express

Last Mile Delivery Market Worth Observing Growth | UPS, FedEx, SF Express

April 23, 2024
3 keys to mitigating severe supply shortages from coronavirus disruption

3 keys to mitigating severe supply shortages from coronavirus disruption

March 18, 2020
Art Battle Wichita Falls III at The Warehouse, 1401 Lamar.

Art Battle Wichita Falls III at The Warehouse, 1401 Lamar.

0
Global Industry Analysis, Size, Share, Growth, Trends, and Forecasts 2016–2024 – ZMR News Reports

Global Industry Analysis, Size, Share, Growth, Trends, and Forecasts 2016–2024 – ZMR News Reports

0
PHOTOS: Ottawa firefighters respond to warehouse fire

PHOTOS: Ottawa firefighters respond to warehouse fire

0
Last Mile Delivery Market Worth Observing Growth | UPS, FedEx, SF Express

Last Mile Delivery Market Worth Observing Growth | UPS, FedEx, SF Express

April 23, 2024
Top 5 Spend Analysis Software ranked in 2024

Top 5 Spend Analysis Software ranked in 2024

March 1, 2024
How Tesla And BMW Are Leading A Supply Chain Renaissance With Blockchain

How Tesla And BMW Are Leading A Supply Chain Renaissance With Blockchain

January 19, 2024
  • Privacy Policy
  • Terms of Use
  • Disclaimer
  • DMCA
  • Contact Us

Copyright © 2024 United States International Supply Chain Commission (usiscc.org)

This website uses cookies to improve your experience. We'll assume you're ok with this, but you can opt-out if you wish. Cookie settingsACCEPT
Privacy & Cookies Policy

Privacy Overview

This website uses cookies to improve your experience while you navigate through the website. Out of these cookies, the cookies that are categorized as necessary are stored on your browser as they are essential for the working of basic functionalities of the website. We also use third-party cookies that help us analyze and understand how you use this website. These cookies will be stored in your browser only with your consent. You also have the option to opt-out of these cookies. But opting out of some of these cookies may have an effect on your browsing experience.
Necessary
Always Enabled

Necessary cookies are absolutely essential for the website to function properly. This category only includes cookies that ensures basic functionalities and security features of the website. These cookies do not store any personal information.

Non-necessary

Any cookies that may not be particularly necessary for the website to function and is used specifically to collect user personal data via analytics, ads, other embedded contents are termed as non-necessary cookies. It is mandatory to procure user consent prior to running these cookies on your website.

SAVE & ACCEPT
No Result
View All Result
  • Supply Chain
  • Logistics
  • Warehousing
  • Procurement
  • Shipping
  • More
    • Strategic Sourcing
    • Spend Analysis
    • Inventory
    • Contact Us

Copyright © 2024 United States International Supply Chain Commission (usiscc.org)