• Latest
  • Trending
  • All
CargoMetrics data reveals depth of China cargo collapse

CargoMetrics data reveals depth of China cargo collapse

February 20, 2020
Last Mile Delivery Market Worth Observing Growth | UPS, FedEx, SF Express

Last Mile Delivery Market Worth Observing Growth | UPS, FedEx, SF Express

April 23, 2024
Top 5 Spend Analysis Software ranked in 2024

Top 5 Spend Analysis Software ranked in 2024

March 1, 2024
How Tesla And BMW Are Leading A Supply Chain Renaissance With Blockchain

How Tesla And BMW Are Leading A Supply Chain Renaissance With Blockchain

January 19, 2024
LATAM Cargo strengthens European cargo links

LATAM Cargo strengthens European cargo links

April 14, 2020
Ford making reusable hospital gowns from airbag materials as efforts against coronavirus expand

Ford making reusable hospital gowns from airbag materials as efforts against coronavirus expand

April 14, 2020
Don’t Sweat NBC’s Decision to Cut Back on Television Ad Inventory

Don’t Sweat NBC’s Decision to Cut Back on Television Ad Inventory

April 14, 2020
Software firms sharpen focus on AI, big data as IT spending drops

Software firms sharpen focus on AI, big data as IT spending drops

April 14, 2020
Navigating turbulent times in your supply chain (TL:DR version)

Navigating turbulent times in your supply chain (TL:DR version)

April 14, 2020
Last Mile Delivery by Drones Market is Booming Worldwide

Last Mile Delivery by Drones Market is Booming Worldwide

April 14, 2020
AIR CARGO MARKET SIZE, SHARE, DEMAND, TREND, LATEST INNOVATIONS & APPLICATION ANALYSIS AND INDUSTRY GROWTH FORECAST 2027 – Science In Me

AIR CARGO MARKET SIZE, SHARE, DEMAND, TREND, LATEST INNOVATIONS & APPLICATION ANALYSIS AND INDUSTRY GROWTH FORECAST 2027 – Science In Me

April 14, 2020
Wheat procurement in Patiala: 6,500 coupons issued to farmers – cities

Wheat procurement in Patiala: 6,500 coupons issued to farmers – cities

April 14, 2020
Pandemic, Plastics And The Continuing Quest For Sustainability

Pandemic, Plastics And The Continuing Quest For Sustainability

April 14, 2020
  • Supply Chain
  • Logistics
  • Warehousing
  • Procurement
  • Shipping
  • More
    • Strategic Sourcing
    • Spend Analysis
    • Inventory
    • Contact Us
No Result
View All Result
United States International Supply Chain Commission
Home Shipping

CargoMetrics data reveals depth of China cargo collapse

by usiscc
February 20, 2020
in Shipping
0
CargoMetrics data reveals depth of China cargo collapse
493
SHARES
1.4k
VIEWS
Share on FacebookShare on Twitter

Just how severely has the coronavirus curtailed cargo flows to and from China, the world’s most important trade engine? Chinese government data is both after-the-fact and suspect, but Boston-based big-data company CargoMetrics is now providing a real-time answer.

CargoMetrics has spent the past decade amassing and analyzing ship-movement data, discerning patterns and developing quantitative predictive algorithms. It’s now bringing its powers to bear on what’s happening in China.

The company has just publicly released data that sheds new light on what transpired in the weeks following Chinese New Year (CNY). To better understand what the numbers mean, FreightWaves interviewed CargoMetrics CEO Scott Borgerson and Dan Brutlag, head of trading signal and data products.

Chinese exports in “freefall”

The first dataset tracks Chinese export tonnage, indexed in relation to CNY (1.0 = 5 days prior to CNY) for 2020 versus the 2012-2019 average.

“The data covers energy, dry, container activity, and other activity,” explained Brutlag. “Our model is based primarily on the net mass transferred by a vessel.” The mass is accounted for on the day it’s transferred on or off the ship.

Asked whether the mass calculation is based on Automatic Identification System (AIS) signals – which include ship draft levels that indicate whether a ship is full, partially full or empty – or on algorithms, Borgerson replied, “Both. We’re receiving over one billion AIS signals a day, and where you can’t get that draft information, we have 10 years of point-in-time data and benchmarking and back testing to inform the logic of the algorithms.”

What CargoMetrics’ data has uncovered is that Chinese imports “are totally in freefall,” said Borgerson.

After Feb. 7, volumes began to nosedive, with the pace of declines accelerating through Feb. 17, the last day of the index data provided by CargoMetrics.

chinese imports
Chart credit: CargoMetrics

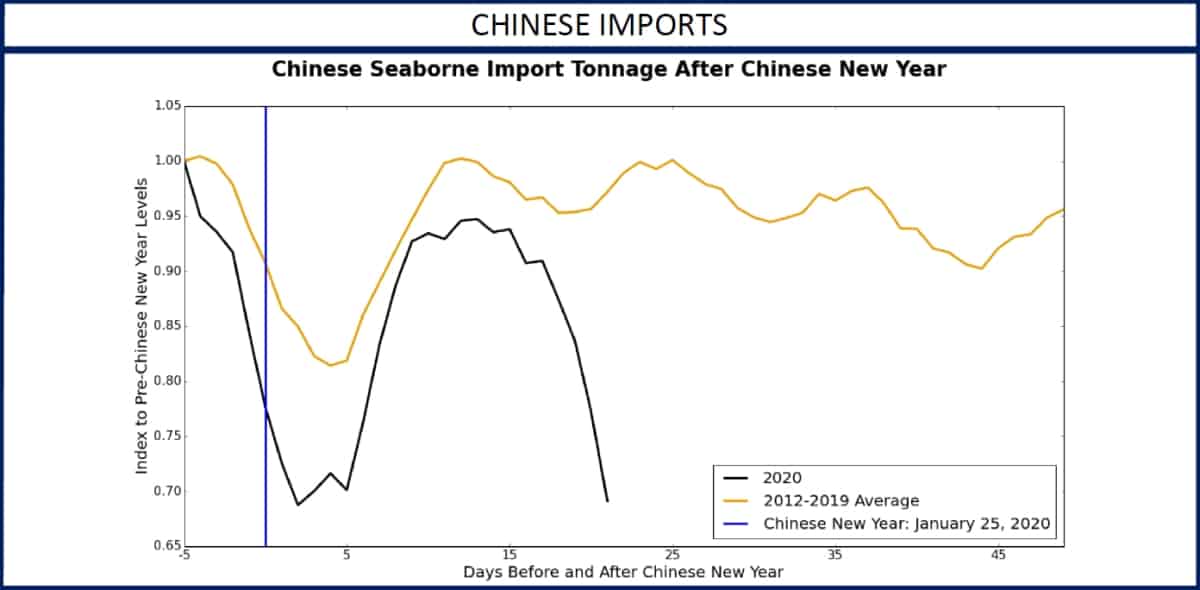
The index declined by 27% between Feb. 7 and Feb. 17. Asked how this breaks down by segment, Brutlag explained, “It’s mainly dry bulk – iron ore and coal – followed by energy and containers. There was actually a slight uptick in container imports in terms of mass being offloaded.” Dry cargo volume is down around 40% compared to the month prior to CNY, he said.

Chinese exports “ugly”

Chinese exports are not showing quite the cliff-esque collapse as imports, but the trend line is “ugly” and diverging from the historical pattern, said Borgerson. Usually, at around the two-week point after CNY, export activity turns positive. This year, it just kept falling.

chinese exports
Chart credit: CargoMetrics

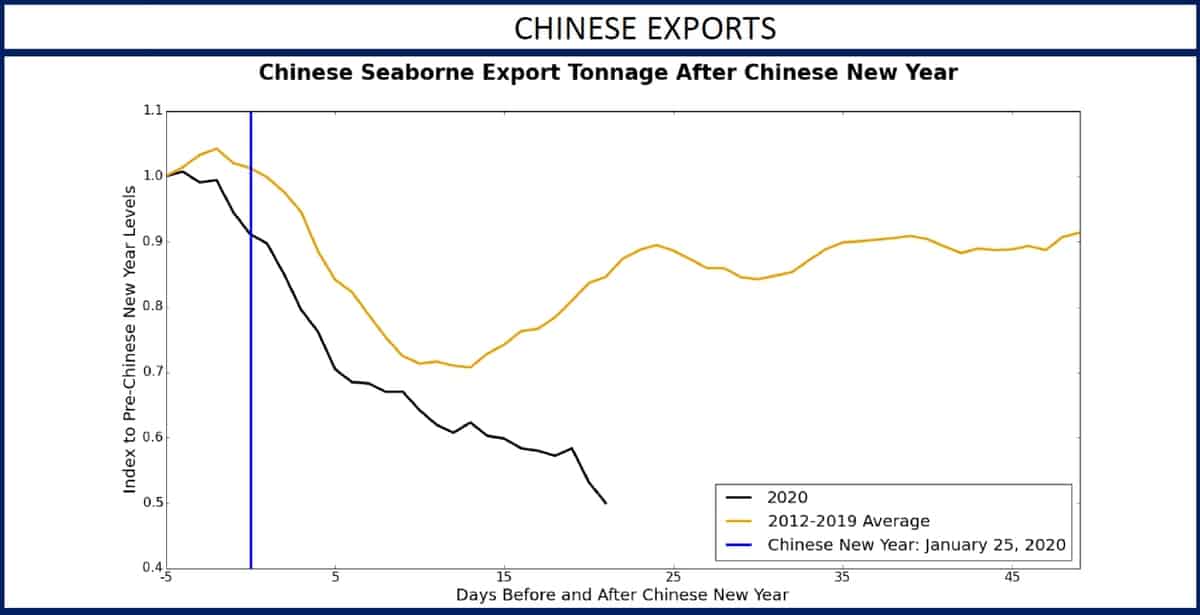
“On the export side, the drop is mainly being driven by container-vessel exports, which are down roughly 60% [versus the month prior to CNY]. We’ve entered the time when we would typically see a recovery and there is no sign of recovery right now, as far as we can tell,” said Brutlag.

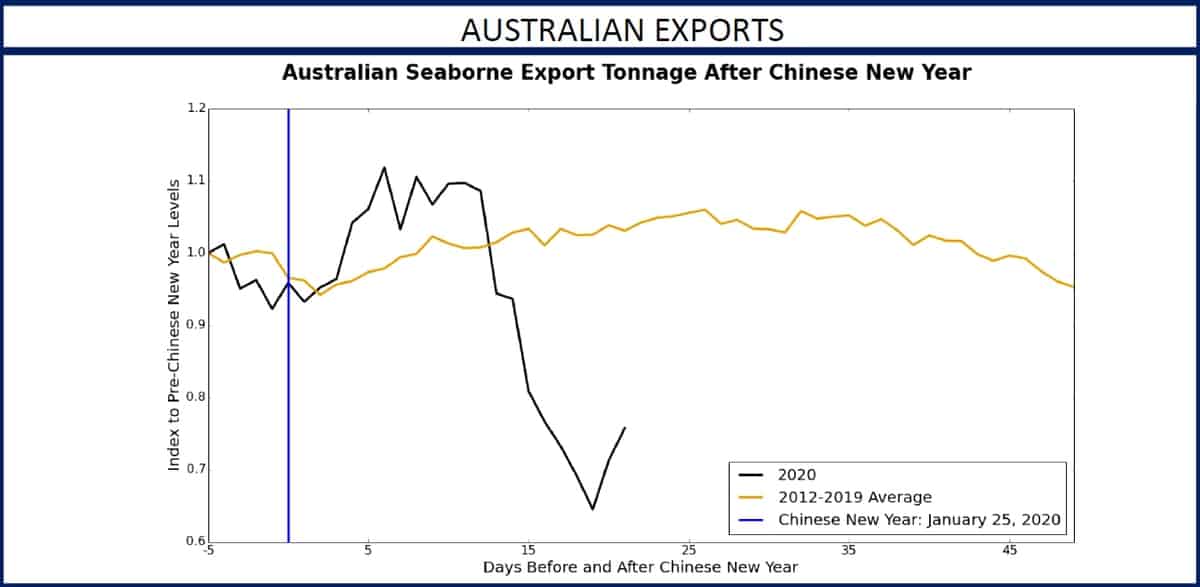
Australian export indicator

Australian export volumes are a key indicator for China, given the huge amount of iron ore and coal that’s shipped. The CargoMetrics data shows that two weeks after CNY, this year’s index pattern began sharply diverging from the 2012-19 average, falling steeply until Feb. 13

On a positive note, volumes have been going back up again from Feb. 13-17. It takes 10-15 days for dry bulk carriers to make the trip from Australia to China, implying that the Chinese import data could rebound when those cargoes arrive. “We’re going to have to watch this [Chinese import] data closely in early March,” said Borgerson.

Australian exports
Chart credit: CargoMetrics

Crude oil in transit

CargoMetrics also tracks global crude oil flows. It has compiled data on the 15-day average of volumes departing the top 10 exporters to China, in relation to CNY timing. “The export data is agnostic to destination so that volume is not necessarily going to China, although historically, a great deal of it has,” said Brutlag.

What this dataset shows is that the volumes are actually up, from 24.9 million barrels per day (b/d) on CNY to around 27.7 million b/d on Feb. 17.

crude oil exports to China
Chart credit: CargoMetrics

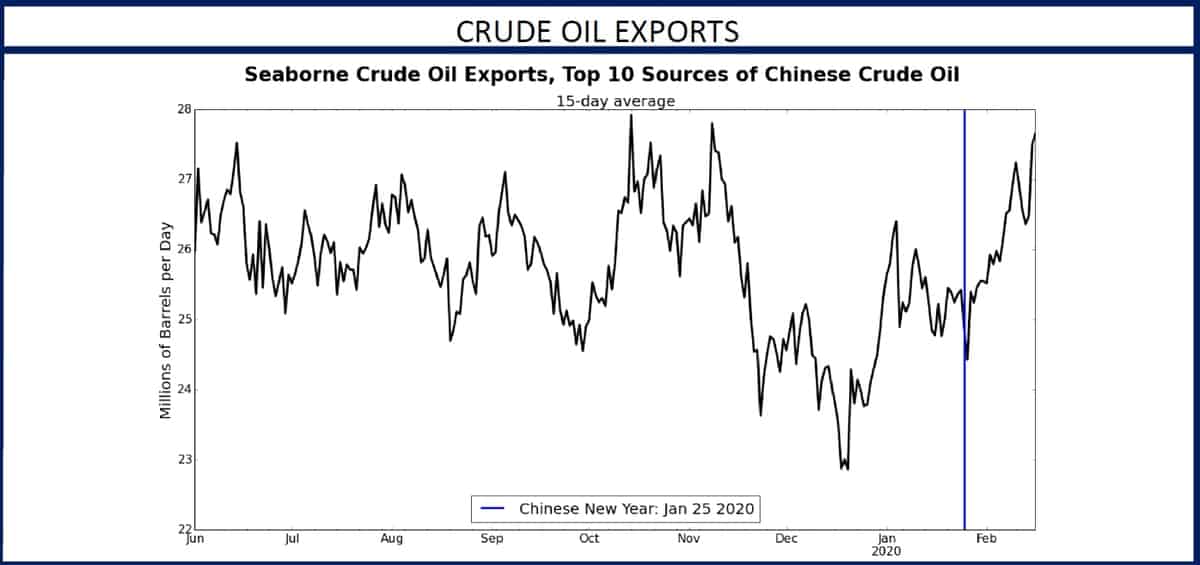
How to resolve the conflict between this data and the nose-diving Chinese import figures? The answer is that it typically takes 30-40 days for transport of crude oil to China. The ships are now in transit. The question is whether they’ll be able to unload when they get there.

“The anchorages could start to get pretty filled up and the ships could become floating storage facilities,” said Borgerson. “On one hand, that could have a counterintuitive [positive] effect on freight rates. On the other hand, if commodities can’t get imported to China, which is the main driver of everything globally for freight and commodities, that is not good.”

What’s next for China?

What happens in the next two weeks is “critical,” asserted Borgerson.

“We’re looking at this purely from the lens of the maritime perspective,” he said. “Shipping moves 90% of the planet’s trade, and while China is not literally an island, its economy is figuratively one because it imports nearly all of its raw materials and exports nearly all of its finished goods by sea. So, the lens we apply is very much a leading indicator for Chinese industry activity and productivity.”

Pressure on the global trade network could be alleviated if “China gets people moving around and factories open up, supply chains can deal with the inventories that are building up, and all the ships that are sailing there can discharge,” he said.

If not, warned Borgerson, “then we’re in uncharted territory.” More FreightWaves/American Shipper articles by Greg Miller

CargoMetrics CEO Scott Borgerson. Photo credit: John Galayda/Marine Money

Share197Tweet123
usiscc

usiscc

  • Trending
  • Comments
  • Latest
Escape From Tarkov – How to Rotate Items

Escape From Tarkov – How to Rotate Items

February 5, 2020
Supply chain examination: Planning for vulnerabilities you can’t control

Supply chain examination: Planning for vulnerabilities you can’t control

December 7, 2019
Procurement Project Manager job with Camden London Borough Council

Procurement Project Manager job with Camden London Borough Council

February 17, 2020
Art Battle Wichita Falls III at The Warehouse, 1401 Lamar.

Art Battle Wichita Falls III at The Warehouse, 1401 Lamar.

0
Global Industry Analysis, Size, Share, Growth, Trends, and Forecasts 2016–2024 – ZMR News Reports

Global Industry Analysis, Size, Share, Growth, Trends, and Forecasts 2016–2024 – ZMR News Reports

0
PHOTOS: Ottawa firefighters respond to warehouse fire

PHOTOS: Ottawa firefighters respond to warehouse fire

0
Last Mile Delivery Market Worth Observing Growth | UPS, FedEx, SF Express

Last Mile Delivery Market Worth Observing Growth | UPS, FedEx, SF Express

April 23, 2024
Top 5 Spend Analysis Software ranked in 2024

Top 5 Spend Analysis Software ranked in 2024

March 1, 2024
How Tesla And BMW Are Leading A Supply Chain Renaissance With Blockchain

How Tesla And BMW Are Leading A Supply Chain Renaissance With Blockchain

January 19, 2024
  • Privacy Policy
  • Terms of Use
  • Disclaimer
  • DMCA
  • Contact Us

Copyright © 2024 United States International Supply Chain Commission (usiscc.org)

This website uses cookies to improve your experience. We'll assume you're ok with this, but you can opt-out if you wish. Cookie settingsACCEPT
Privacy & Cookies Policy

Privacy Overview

This website uses cookies to improve your experience while you navigate through the website. Out of these cookies, the cookies that are categorized as necessary are stored on your browser as they are essential for the working of basic functionalities of the website. We also use third-party cookies that help us analyze and understand how you use this website. These cookies will be stored in your browser only with your consent. You also have the option to opt-out of these cookies. But opting out of some of these cookies may have an effect on your browsing experience.
Necessary
Always Enabled

Necessary cookies are absolutely essential for the website to function properly. This category only includes cookies that ensures basic functionalities and security features of the website. These cookies do not store any personal information.

Non-necessary

Any cookies that may not be particularly necessary for the website to function and is used specifically to collect user personal data via analytics, ads, other embedded contents are termed as non-necessary cookies. It is mandatory to procure user consent prior to running these cookies on your website.

SAVE & ACCEPT
No Result
View All Result
  • Supply Chain
  • Logistics
  • Warehousing
  • Procurement
  • Shipping
  • More
    • Strategic Sourcing
    • Spend Analysis
    • Inventory
    • Contact Us

Copyright © 2024 United States International Supply Chain Commission (usiscc.org)