


This week’s DHL Supply Chain Pricing Power Index: 30 (Shippers)
Last week’s DHL Supply Chain Pricing Power Index: 35 (Shippers)
Three-month DHL Supply Chain Pricing Power Index Outlook: 45 (Shippers)
The DHL Supply Chain Pricing Power Index uses the analytics and data contained in FreightWaves SONAR to analyze the market and estimate the negotiating power for rates between shippers and carriers.
This week, weak transportation earnings and falling tender rejections carried the day. Muted volumes and tumbling spot rates also helped the shippers gain more pricing power this week.
The Pricing Power Index is based on the following indicators:
Load volumes: Momentum and trend neutral
The Outbound Tender Volume Index (OTVI.USA) has stayed relatively horizontal below its March 2018 starting point of 10,000 since it recovered from its New Year’s trough.
The index currently sits at 9,696.86, which is slightly above its yearly comparable by less than 1%. At this point in the year, it is important to dissect our Outbound Tender Volume Index into its two largest components: van and reefer volumes.
Van volumes in 2020 are almost identical to 2019 at this point (up 0.8%), but they had been slightly up in the low-single-digit range for the past three weeks. A different story is visible when analyzing reefer volumes. Outbound reefer volumes are still up nearly 15% year-over-year due in part to particularly cold weather in the Midwest. It may seem counterintuitive for reefer volumes to soar in cold weather, but reefer trailers are used to keep freight from freezing in the winter.
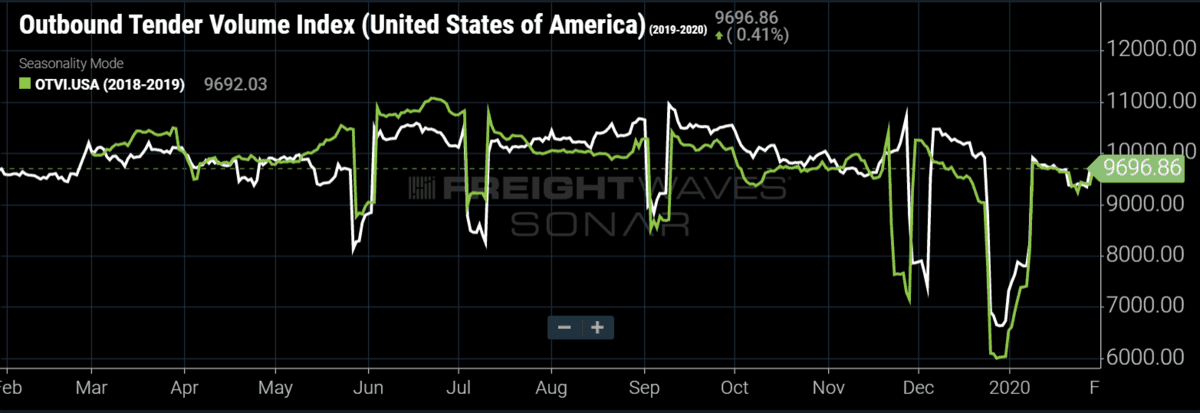
SONAR: OTVI.USA(Green — 2018-19; White — 2019-20)
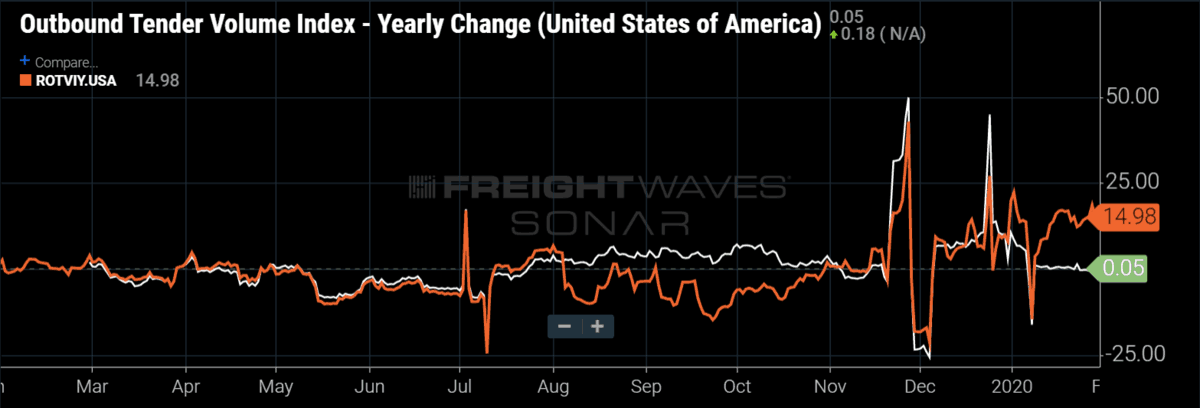
SONAR: OTVIY.USA; ROTVIY.USA(White — Outbound Tender Volume Yearly Change; Orange — Reefer Outbound Tender Volume Yearly Change)
Tender rejections: Absolute levels neutral, momentum positive for shippers
After peaking at 14.25% on Christmas Day, the Outbound Tender Reject Index (OTRI) has slipped to 6.04%. This is four straight weeks of declining tender rejections off the peak. The index has now given back most of the peak season bump and has fallen further into negative territory compared to this time last year. It remains to be seen whether the lows of 3.75% from August 2019 are in play. Lastly, overall outbound tender rejections are being boosted by continued stubbornly high reefer rejections, which currently sit at 14.02%.
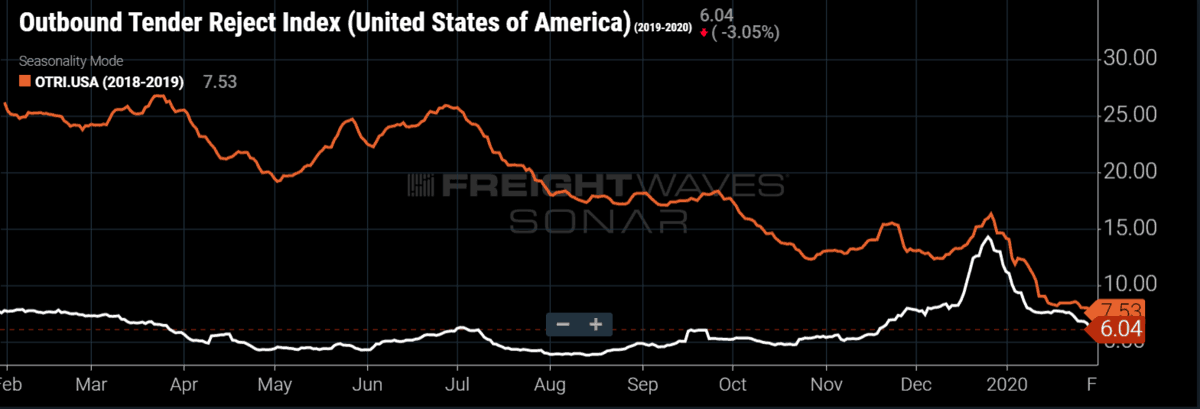
SONAR: OTRI.USA(White — 2019-20; Orange — 2018-19)
Spot rates: Absolute level positive for shippers, momentum neutral
Spot rates have tumbled from Christmas highs of $1.62 per mile to a current $1.41 per mile. Spot rates are down $0.07 per mile since last week. It seems the DAT freight rate (DATVF.VNU) has peaked, at least for the next few weeks. Spot rates ended the year on a seasonal tear, increasing 15% over the last eight weeks of the year. But as we have written for the past several weeks, the January blues are in full session and we don’t expect any snapback in spot rates in the coming weeks.
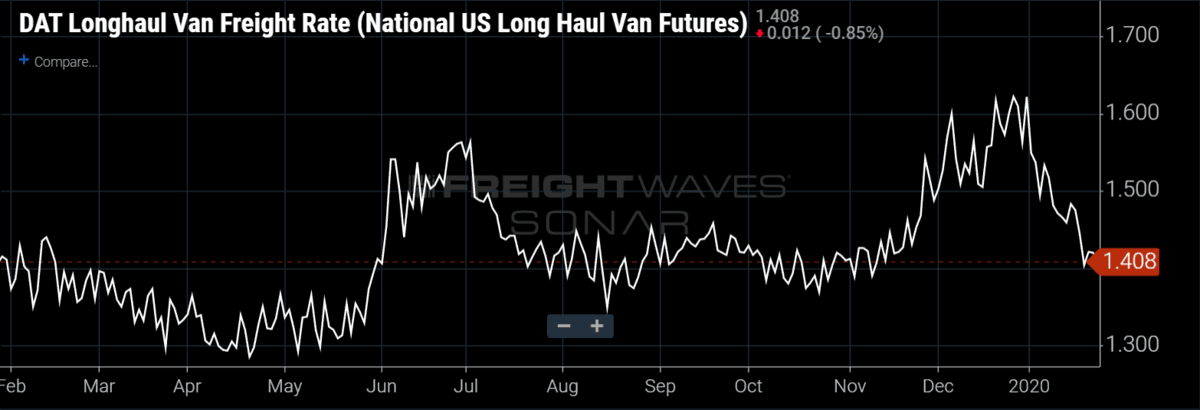
SONAR: DATVF.VNU
Economic stats: Momentum and absolute level neutral
The U.S. economy grew 2.1% on a seasonally adjusted annual rate (SAAR) basis in the fourth quarter, in line with consensus estimates. On a year-over-year basis compared to the fourth quarter of 2018, real GDP (RDGP.USA) grew 2.3%. For full-year 2019, U.S. real GDP grew by 2.3% year-over-year. The latter was the slowest growth in real GDP in three years as 2018 saw a 2.8% increase and 2017 saw a 2.4% gain. Consumer spending (which accounts for 68% of GDP), as measured by personal consumption expenditures (RPCE.USA), rose at 1.8%, slowing from 3.2% in the third quarter and 4.6% in the second quarter. Nonresidential fixed investment (RFPI.NRES) was a weak spot, declining at a 1.5% annualized rate due to a drag from investment in structures and equipment. On the other hand, residential fixed investment (RFPI.RES) was a bright spot, rising at a 5.8% annualized rate, reflecting strength in the housing sector.
Overall, the 2.1% real GDP (RGDP.USA) growth in the fourth quarter is disappointing in light of the deceleration from recent quarters but is in line with broader trends since the economic expansion began this cycle in 2009. The read-through to flatbed volumes (FOTVI.USA) and tender rejections (FOTRI.USA) is mixed given the strong residential fixed investment (RFPI.RES) growth against weak nonresidential fixed investment (RFPI.NRES). The continued weakness in the manufacturing and industrial economy continues to be reflected in tepid flatbed outbound tender rejections (FOTRI.USA), which are hovering around the all-time low (5%) since we began tracking the data in SONAR in early 2018.
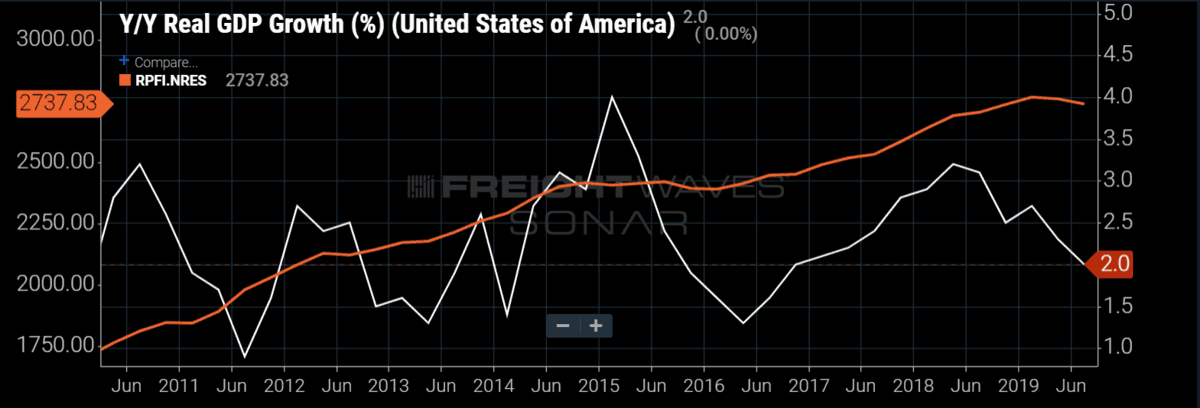
SONAR Tickers: RGDPY.USA, RFPI.NRES
This week we also got data from the Conference Board’s consumer confidence Index, which came in at 131.6 for January, a 5-point increase from December and the highest reading since August 2019. This report suggests a continuation of the ongoing strength of the consumer.
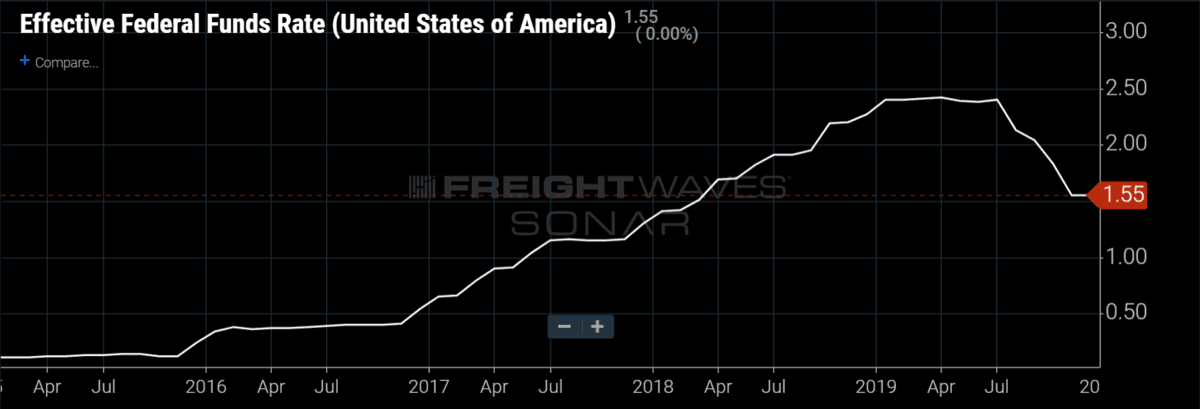
Lastly, on Wednesday, the Federal Reserve left interest rates unchanged, holding its target for the effective Federal funds rate at a range of 1.5-1.75%. The Fed said that they would maintain their balance sheet expansion via their purchase of Treasury Bills through at least April 2020. The Fed will also continue with its overnight repurchase agreement operations (Repo program), though Fed Chairman Jerome Powell continues to maintain these activities do not represent a new round of quantitative easing (QE).
Transportation stock indices: Absolute levels positive for shippers, momentum positive for carriers
All of the FreightWaves transportation stock indexes were down big this week (and down for the second straight week) as the spreading coronavirus spooked global markets and a spate of disappointing transportation earnings reports arrived. The logistics index fell 6.4% on the back of an earnings miss from C.H. Robinson. The parcel index fell 6.1% due to a revenue miss and weaker-than-expected guidance from UPS. Our truckload and LTL indexes were the best performers, each down 2% this week.
This past week Knight Swift (KNX), Schneider (SNDR), Covenant (CVTI), Landstar (LSTR) and C.H. Robinson (CHRW), among others, reported earnings. With the exception of KNX, which was able to beat its already negatively preannounced earnings range, every company missed Wall Street’s consensus estimates and issued disappointing guidance. Recurring themes continue to reassert themselves, including excess capacity and weak spot and contract pricing driving down revenues year-over-year, with the negative effects to the bottom line magnified through deleverage on fixed operating expenses.
Landstar’s fourth-quarter results as well as its first-quarter guidance were negatively impacted by nuclear verdicts from deadly accidents involving its contracted drivers. C.H. Robinson suffered from the squeeze of falling contract pricing paired with rising spot prices, in addition to likely feeling some impact from increasing competition via digital and other fast-growing brokers. Knight Swift, however, did issue relatively upbeat commentary regarding the outlook for contract pricing and bid negotiations in the back half of 2020.
All in all, though, the momentum seen in peak season for trucking appears to be waning, at least somewhat and if only temporarily. “In November and December, the word that I was getting was that capacity is tightening, carriers were getting excited about what was coming, so it was really positive coming into the new year. In the last couple weeks, I’ve heard the complete opposite from carriers with very few exceptions,” said Chris Henry, FreightWaves employee and president of the TCA inGauge Profitability Program.
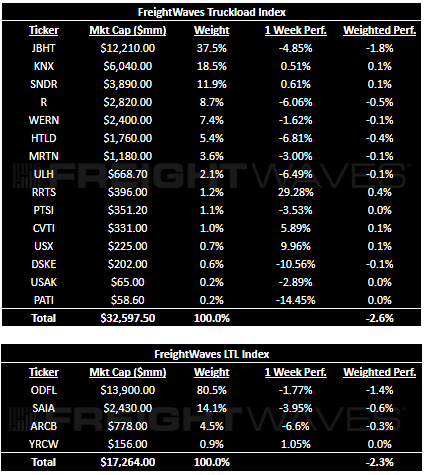
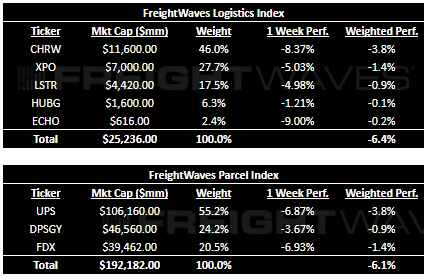
Image Sourced from Pixabay


