• Latest
  • Trending
  • All
February 2020 Housing Data: The Latest Proof Of Cycle Analysis

February 2020 Housing Data: The Latest Proof Of Cycle Analysis

March 1, 2020
Last Mile Delivery Market Worth Observing Growth | UPS, FedEx, SF Express

Last Mile Delivery Market Worth Observing Growth | UPS, FedEx, SF Express

April 23, 2024
Top 5 Spend Analysis Software ranked in 2024

Top 5 Spend Analysis Software ranked in 2024

March 1, 2024
How Tesla And BMW Are Leading A Supply Chain Renaissance With Blockchain

How Tesla And BMW Are Leading A Supply Chain Renaissance With Blockchain

January 19, 2024
LATAM Cargo strengthens European cargo links

LATAM Cargo strengthens European cargo links

April 14, 2020
Ford making reusable hospital gowns from airbag materials as efforts against coronavirus expand

Ford making reusable hospital gowns from airbag materials as efforts against coronavirus expand

April 14, 2020
Don’t Sweat NBC’s Decision to Cut Back on Television Ad Inventory

Don’t Sweat NBC’s Decision to Cut Back on Television Ad Inventory

April 14, 2020
Software firms sharpen focus on AI, big data as IT spending drops

Software firms sharpen focus on AI, big data as IT spending drops

April 14, 2020
Navigating turbulent times in your supply chain (TL:DR version)

Navigating turbulent times in your supply chain (TL:DR version)

April 14, 2020
Last Mile Delivery by Drones Market is Booming Worldwide

Last Mile Delivery by Drones Market is Booming Worldwide

April 14, 2020
AIR CARGO MARKET SIZE, SHARE, DEMAND, TREND, LATEST INNOVATIONS & APPLICATION ANALYSIS AND INDUSTRY GROWTH FORECAST 2027 – Science In Me

AIR CARGO MARKET SIZE, SHARE, DEMAND, TREND, LATEST INNOVATIONS & APPLICATION ANALYSIS AND INDUSTRY GROWTH FORECAST 2027 – Science In Me

April 14, 2020
Wheat procurement in Patiala: 6,500 coupons issued to farmers – cities

Wheat procurement in Patiala: 6,500 coupons issued to farmers – cities

April 14, 2020
Pandemic, Plastics And The Continuing Quest For Sustainability

Pandemic, Plastics And The Continuing Quest For Sustainability

April 14, 2020
  • Supply Chain
  • Logistics
  • Warehousing
  • Procurement
  • Shipping
  • More
    • Strategic Sourcing
    • Spend Analysis
    • Inventory
    • Contact Us
No Result
View All Result
United States International Supply Chain Commission
Home Inventory

February 2020 Housing Data: The Latest Proof Of Cycle Analysis

by usiscc
March 1, 2020
in Inventory
0
February 2020 Housing Data: The Latest Proof Of Cycle Analysis
492
SHARES
1.4k
VIEWS
Share on FacebookShare on Twitter

Introduction

Housing is a very important long leading indicator for the economy (as in, 12 to 18 months out).This is both because of the long period of time during which money is spent on building the house, and the subsequent period of landscaping and furnishing the house and property.

For more than five years, see for example, here, here, here, here, and here, I have had a simple mantra to explain the housing cycle:

  • Interest rates lead sales
  • Sales lead prices
  • Prices lead inventory

The housing data released over the past several weeks shows the correctness of this formulation of the housing cycle perfectly, with implications for the next 12 – 18 months. Let’s take a comprehensive look.

The Housing Cycle as of February 2020

1. Interest rates lead sales

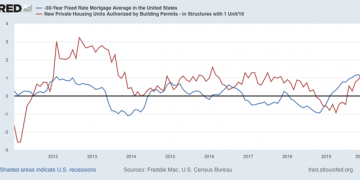
Housing, measured YoY in the graph below (red) by single-family permits, tends to follow mortgage rates (inverted, blue) with about a four- to six-month lag (shown YoY%)

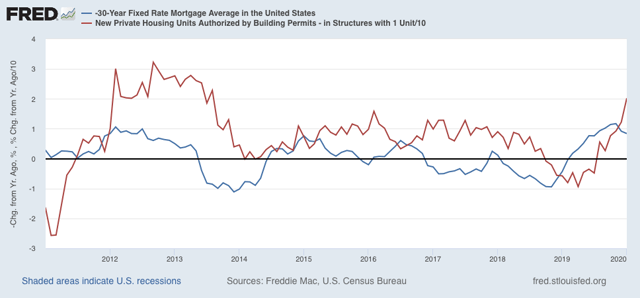
Mortgage interest rates peaked in November 2018, made lows last September, and then new lows in the past several weeks. Single family permits made a low 5 months later in April 2019, and have rebounded since.

2. Sales lead prices

Here are single-family permits again (red, left scale) and the FHFA house price index (blue) and the Case Shiller National index (green, deflated by average hourly earnings, right):

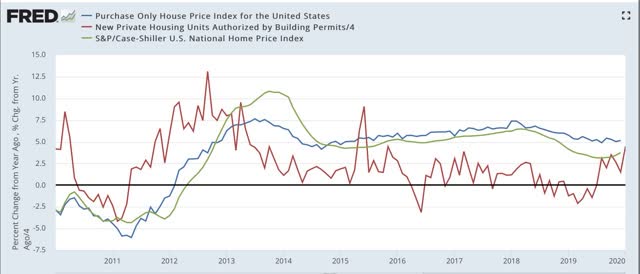
The trough for both the FHFA and the Case Shiller indexes was last August. The YoY change increased m/m for the FHFA from 4.9% to 5.1% in December. For the Case Shiller national index the YoY rate of change increased from 3.5% to 3.8%.

3. Prices lead inventory

Yesterday morning new home sales and inventory were reported. Below is a graph of the FHFA purchase only house price index (GOLD), the Case Shiller national index (red) and inventory of new homes for sale (green) measured YoY:

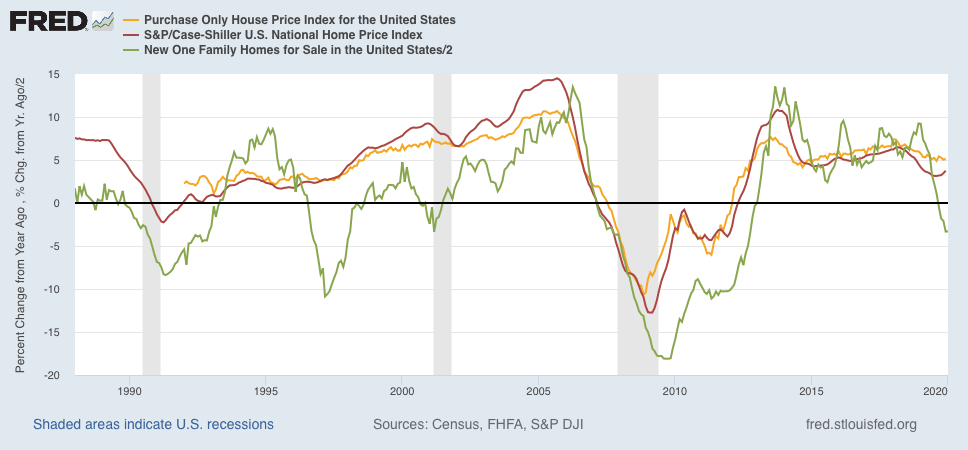
With the exception of the 1999-2002 portion of the housing bubble, inventory has lagged prices.

Finally, BillMcBride a/k/a Calculated Risk says every month that he looks at inventory for clues to the trajectory of housing sales. As I’ve shown above, it is clear that sales (red in the graph below) lead inventory (green). That being said, when we go to the first derivative, and look at the YoY% *changes* in inventory, it does help us forecast the near term trajectory of sales:

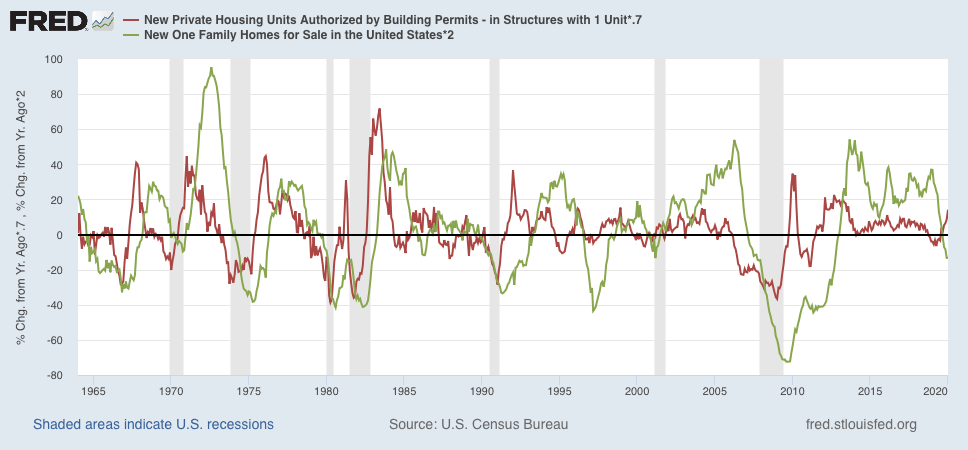
When the trajectory of inventory changes (green) has been rising i.e., either inventory declines are decelerating, or inventory gains are accelerating) that tells us that sales growth is going to decelerate, or in the latter case, decline. Conversely, with the exception of 1990, if the trajectory of inventory changes has been falling (either decelerating gains or accelerating declines), that tells us that sales are likely to increase.

Conclusion: Implications for the remainder of 2020

February’s housing reports all have shown the continuing validity of the housing cycle mantra I have written about for going on a decade.

As shown above, until the last week or so, over the past 6 months interest rates have generally gone sideways. That tells us to expect that increases in the absolute levels of housing sales, permits, and starts are likely to at very least slow down in the months ahead (since interest rates lead sales by about 4 to 6 months). On a YoY basis, however, sales are likely to continue to post increasing gains.

Since sales have increased for nearly a year, the decelerating in price gains that bottomed late last autumn is almost certainly over. Accelerating price gains are likely in the months ahead (which will crimp potential buyers’ budgets).

Inventory has probably just bottomed. On a YoY basis it is still accelerating to the downside. Aside from possible impacts from coronavirus, there is no reason to expect sales to turn down anytime in the immediate future.

Disclosure: I/we have no positions in any stocks mentioned, and no plans to initiate any positions within the next 72 hours. I wrote this article myself, and it expresses my own opinions. I am not receiving compensation for it (other than from Seeking Alpha). I have no business relationship with any company whose stock is mentioned in this article.

Share197Tweet123
usiscc

usiscc

  • Trending
  • Comments
  • Latest
Escape From Tarkov – How to Rotate Items

Escape From Tarkov – How to Rotate Items

February 5, 2020
Supply chain examination: Planning for vulnerabilities you can’t control

Supply chain examination: Planning for vulnerabilities you can’t control

December 7, 2019
Procurement Project Manager job with Camden London Borough Council

Procurement Project Manager job with Camden London Borough Council

February 17, 2020
Art Battle Wichita Falls III at The Warehouse, 1401 Lamar.

Art Battle Wichita Falls III at The Warehouse, 1401 Lamar.

0
Global Industry Analysis, Size, Share, Growth, Trends, and Forecasts 2016–2024 – ZMR News Reports

Global Industry Analysis, Size, Share, Growth, Trends, and Forecasts 2016–2024 – ZMR News Reports

0
PHOTOS: Ottawa firefighters respond to warehouse fire

PHOTOS: Ottawa firefighters respond to warehouse fire

0
Last Mile Delivery Market Worth Observing Growth | UPS, FedEx, SF Express

Last Mile Delivery Market Worth Observing Growth | UPS, FedEx, SF Express

April 23, 2024
Top 5 Spend Analysis Software ranked in 2024

Top 5 Spend Analysis Software ranked in 2024

March 1, 2024
How Tesla And BMW Are Leading A Supply Chain Renaissance With Blockchain

How Tesla And BMW Are Leading A Supply Chain Renaissance With Blockchain

January 19, 2024
  • Privacy Policy
  • Terms of Use
  • Disclaimer
  • DMCA
  • Contact Us

Copyright © 2024 United States International Supply Chain Commission (usiscc.org)

This website uses cookies to improve your experience. We'll assume you're ok with this, but you can opt-out if you wish. Cookie settingsACCEPT
Privacy & Cookies Policy

Privacy Overview

This website uses cookies to improve your experience while you navigate through the website. Out of these cookies, the cookies that are categorized as necessary are stored on your browser as they are essential for the working of basic functionalities of the website. We also use third-party cookies that help us analyze and understand how you use this website. These cookies will be stored in your browser only with your consent. You also have the option to opt-out of these cookies. But opting out of some of these cookies may have an effect on your browsing experience.
Necessary
Always Enabled

Necessary cookies are absolutely essential for the website to function properly. This category only includes cookies that ensures basic functionalities and security features of the website. These cookies do not store any personal information.

Non-necessary

Any cookies that may not be particularly necessary for the website to function and is used specifically to collect user personal data via analytics, ads, other embedded contents are termed as non-necessary cookies. It is mandatory to procure user consent prior to running these cookies on your website.

SAVE & ACCEPT
No Result
View All Result
  • Supply Chain
  • Logistics
  • Warehousing
  • Procurement
  • Shipping
  • More
    • Strategic Sourcing
    • Spend Analysis
    • Inventory
    • Contact Us

Copyright © 2024 United States International Supply Chain Commission (usiscc.org)