


Macy’s (M) is one of those names that pop up on value screens quite often. It has on mine as well and I have been following the stock for a while, although I have to say it hasn’t given me any sound reason to bet on a turnaround so far. Last quarter’s results were another confirmation of this, as I found the report much weaker and shady than the pure headlines would suggest, while the management made the usual excuses to justify the poor performance.
We know, comp sales down 3.5% already made a good headline to describe how poor the quarter was. However, a deeper look at inventory dynamics shows other signs of weakness that shouldn’t be underestimated.
The management commented the poor results pointing to external headwinds such as warm weather and difficult comparisons with last year.
However, having cleared the excess inventory we faced earlier in the year, we were able to take a more balanced approach to sales and profit in the quarter. Versus the first half of this year, this resulted in a significantly improved margin compression on lower sales.
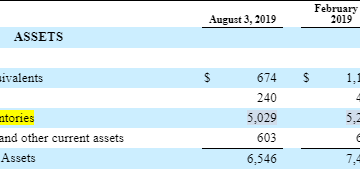
The first part of this statement required some serious fact-checking. I would like to understand why $7,256m in merchandise inventory translate into a level where excesses have been cleared. This level of inventory is still 1.5% higher than it was in the corresponding quarter of 2018 while sales have declined 4.3% in the meantime, for a 5.8% gap between inventory growth and sales growth. It’s helpful to compare these numbers to what happened in the first part of the year.
In Q2, inventory levels at $5,029m were 1.47% higher than the previous year vs. a 0.46% decline in revenue – almost a 2% gap between inventory growth and sales growth.

Source: Company’s filings
In Q1, inventories were up 3.9% y/y vs. a 0.7% decline in sales – a 4.6% gap between inventory growth and sales growth.

Source: Company’s filings
Since 5.8% is higher than both 2% and 4.6%, we can see that not only is there no evidence of successful clearance of previously accumulated excess inventory, but inventory levels as a percentage of sales are actually increasing faster than they did in the first part of the year.
A deeper look at the numbers explains this better:

Source: Author’s calculations
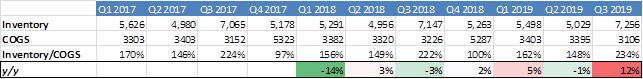
As we can see in the table above, inventory as a percentage of sales showed an 801bps y/y increase, the highest increase in the 3 years analyzed. In the table, I compared quarterly inventory to quarterly sales, and then calculated the y/y variation. The negative trend is clear.
Another way to analyze the same problem is to compare inventory to the cost of goods sold in order to neutralize the impact of discounts and promotions on sales. Applying the same criterion, we can see that the ratio of inventory to COGS has increased even more and posted a very visible spike in Q3 2019.
Source: Author’s calculations
Since there doesn’t seem to be any reason to expect a re-acceleration in the business (guidance numbers confirm) to justify this accumulation of inventory beyond seasonality, this is either a sign of declining efficiency or deeper demand problems emerging, or a combination of both.
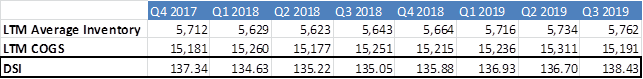
In terms of repercussion on efficiency metrics, we can see that Days Sales in Inventory are growing.
Source: Author’s calculations
So inventory dynamics are showing deterioration, rather than improvement. The management also mentioned that versus the first half of this year, the recent inventory clearance resulted in a significantly improved margin compression on lower sales.
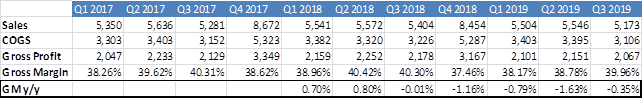
And it’s true, gross margin has declined but not as much as it did in Q1 and Q2.
Source: Author’s calculations
However, I think the management’s comment on inventory and gross margin trends creates confusion and leads to a wrong interpretation. Given the sharp increase in inventory vs. revenue and COGS, it’s clear that gross margin would have been lower if inventory clearance had been more aggressive.
In other words, I believe that the reason why gross margin hasn’t declined too much is exactly that the management hasn’t been aggressive enough in clearing inventory. This translates into a more moderate gross margin decline but a sudden sharp increase in inventory as a percentage of revenue and COGS.
I think these trends in inventory vs. sales and COGS should anticipate further weakness in the coming quarters. The management mentioned unfavorable weather conditions as one of the main reasons why sales were weak. Although this excuse is particularly frequent, I will give them the benefit of the doubt because in Q3 2018 they were honest enough to admit that favorable weather conditions were a tailwind:
Turning to families of business. We delivered another strong quarter in men’s and kids, fine jewelry, women’s shoes, fragrances, coats and activewear offsetting some underperformance in fashion watches and women’s sportswear. We’ve benefited late in the quarter from cold weather.
Soft international tourism has also been mentioned as a headwind, not only this quarter but in the previous three as well. In this context, it seems that Macy’s business is still deeply dependent on those external factors. To see a turnaround, it’s necessary to see improvement in those trends. In any case, a look at inventory dynamics shows that the situation is deteriorating and recently created imbalances will probably have further negative repercussions on revenue and margins in the near future.
Disclosure: I/we have no positions in any stocks mentioned, and no plans to initiate any positions within the next 72 hours. I wrote this article myself, and it expresses my own opinions. I am not receiving compensation for it (other than from Seeking Alpha). I have no business relationship with any company whose stock is mentioned in this article.


