


![]()
Source: underarmour.com
Under Armour (UA) (UAA) has been a typical example of a company that ends up being a victim of its own success. After the fad of 2014-2016, Under Armour’s fundamentals experienced a disastrous deterioration. The stock posted a crash for two years and then moved sideways despite the stock market’s bull run. As it’s typical of these fad-driven stories, Under Armour had to face margin and cash-flow deterioration, together with exploding inventories. In these situations, the ability to stabilize inventories and prices/margins become two key ingredients to hope for an improvement and effectively time a potential entry. In this article, I analyze Under Armour’s inventory, cash flows and margin trends to understand whether they suggest a real and consistent improvement in fundamentals.
A Bit Of Context
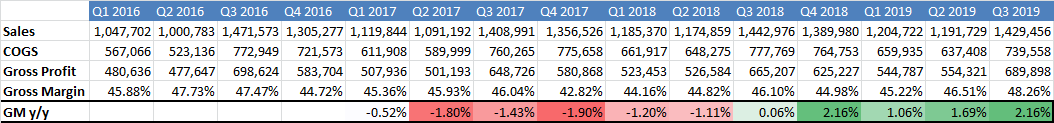
When consumer fads burst, we can see which companies have been effective in managing their own success and which ones have failed to control the impact of the obvious deterioration in sales growth and pricing power that had to be expected. For Under Armour, it’s clear that the management did a poor job in controlling its own success. While sales growth went from above 30% in 2014 to low-single digits a few years later, gross margin crashed over 500bps and operating margin contracted from above 11% to the 2%-3% range in 2018-2019.
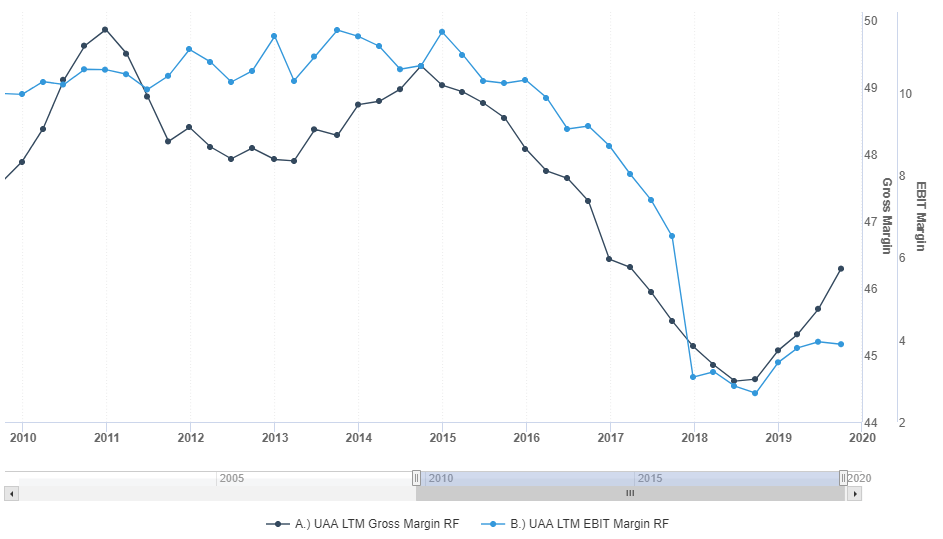
Source: Sentieo
In recent quarters, both these key profitability metrics started to improve, potentially highlighting a stabilization of fundamentals. The analysis of inventory dynamics will help us assess whether this improvement is consistent and potentially long-lasting or just a flash in the pan.
Inventory Dynamics Some Improvements
Let’s look at some key metrics:
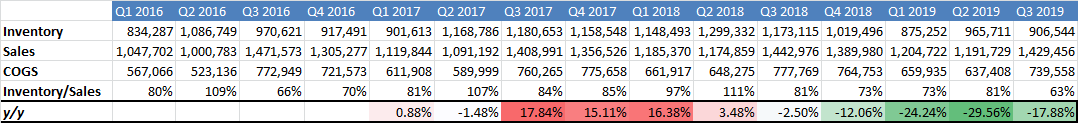
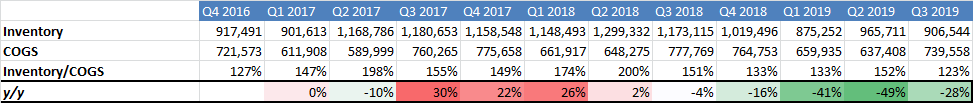
Source: Author’s calculations based on data from filings
A few highlights:
• Inventory/Sales was running at very high levels for most of 2016-2018, with peaks of 111% in Q2 2018 (as the seasonal pattern shows, Q2 is clearly a quarter of inventory accumulation). To make a comparison, Nike (NKE) was consistently in the 52%-62% in the same time frame, even during the periods of inventory accumulation, and seems to be a good comparison as it operates in the same business and usually has similar gross margins.
• Starting in Q3 2018, Inventory/Sales has improved substantially and reached a new low of 63% in Q3 2019.
• While similar levels were registered in 2016, I see the recent trends as fundamentally different, as they come with an improvement in margins instead of the clear deterioration experienced in 2016.
Source: Author’s calculations based on data from filings
Although to be taken with caution, the combination of improving gross margin and lower level of inventories suggests that the improvement in inventory dynamics is not coming from lower selling prices or other aggressive market practices.
Last quarter, the management was quite proud of the company’s achievements on the front of inventory management:
So before I wrap it up, I’d be remiss to not talk about the incredible progress we continue to make in inventory management. Coming in well ahead of our expectations, we posted a 23% decline in inventory. Improving service levels and much tighter buys to customer demand, coupled with products selling through at a rate higher than we had anticipated, means we’ve had lower returns and therefore don’t have much excess product to sell in the off-price channel.
I agree that there has been a significant and consistent improvement on that side, especially if we consider the negative impact of tariffs, which have surely contributed in part to put downward pressure on margins and upward pressure on inventories. In terms of outlook, the management was also positive, expecting an improvement next quarter as well, although not as strong as in the last few quarters:
And finally, given the continuing improvements and efficiencies we are experiencing within our supply chain, we now expect end-of-year inventory to be down at a low double-digit rate.
If we don’t question this forecast, inventory down at a double-digit rate and revenue slightly up means that inventory-to-sales should post a percentage decline in the mid-teens, potentially reaching levels below 60% and a new low. For two quarters in a row, inventory-to-sales would be finally comparable to a titan of efficiency such as Nike, although this should be taken with a grain of salt as different styles of inventory management might create distortions.
Let’s look at this topic from a few other perspectives. Let’s focus on cost of goods sold instead of sales, so that we can avoid the impact of fluctuations in selling prices.
Source: Author’s calculations based on data from filings
• The trends and the recent improvement are consistent with what we saw when we compared inventory trends to sales trends.
• To make a comparison, Nike’s inventory to COGS ratio runs in the 85%-110% area depending on the impact of seasonality. So again, we are not very far from Under Armour’s recent levels, especially with the improvement expected by the management.
The message is the same if we look at other important ratios such as Days’ Sales in Inventory:

Source: Author’s calculations based on data from filings
The consistent improvement over time is clear. It takes significantly less for Under Armour to fully sell its inventory vs. one or two years ago, and the metric should improve further if the management is correct.
Cash Flow Dynamics Confirm Improving Trends
The analysis of cash flow dynamics is a key component of the analysis for any company, and it’s even more important when we assess the prospects of a company working on a turnaround such as Under Armour.
Cash flows are rather volatile if we look at quarterly variations, which is consistent with the seasonality of the business.
![]()
Source: Author’s calculations based on data from filings
However, also year-over-year variations are quite volatile and don’t offer a clear picture of the underlying trends:

Source: Author’s calculations based on data from filings
The best way to analyze these trends is to look at the variations in TTM (trailing-twelve-months) data.

Source: Author’s calculations based on data from filings
There are some key messages we get from the table above:
• Cash flow from operations has improved substantially, consistently and roughly doubled since the end of 2016 while TTM revenue is less than 10% higher. The better trends in operating cash flows are consistent with the overall improvements in margins and inventory dynamics.
• While the company keeps investing, cash flows from investing activities are not as negative as they used to be and roughly halved since the end of 2016. I see this as an indication that the dumb strategy of revenue growth at all costs has been abandoned and the company is now using a more reasonable approach that may have at least some chances of creating real long-term value for shareholders.
• Cash flow from financing has been negative for a while as the company is repaying debt and improving its capital structure. Reducing debt is not a strict necessity though. $600 million in financial debt or around $1.3B including lease liabilities are more than sustainable if Under Armour’s operating cash flow doesn’t start to deteriorate again. In any case, I welcome the management’s new focus on controlling risk vs. the old approach based on pushing expansion on top of a fad without a sound strategy.
Technical Update
From a technical perspective, Under Armour stock has been in a strong downtrend since the middle of 2015 and has depicted a potential multi-year continuation head and shoulder pattern with a complex structure. This would need confirmation via the breakdown of the neckline with current support in the $17 area.
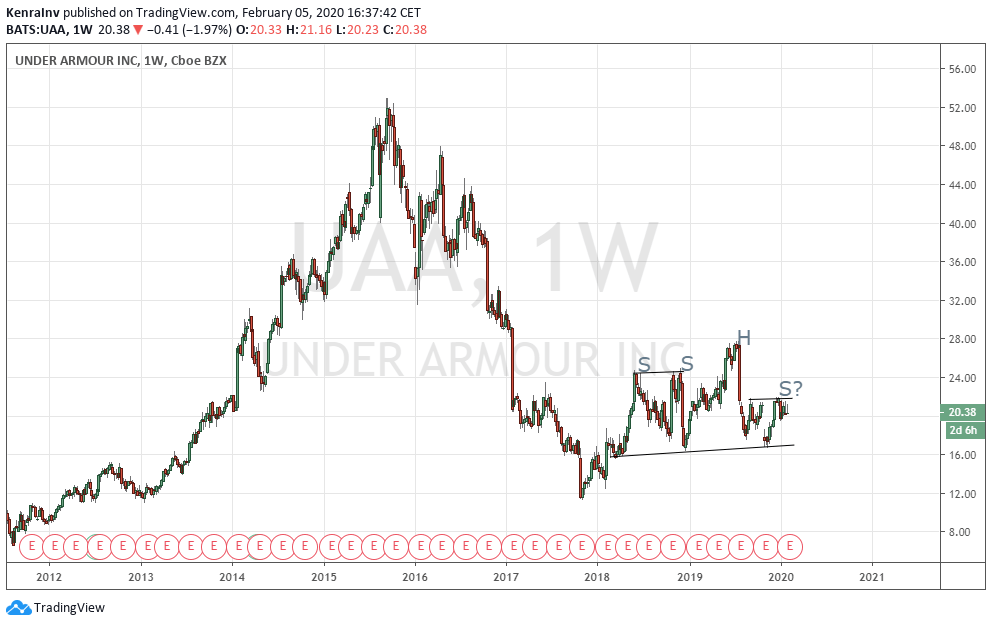
Source: tradingview.com
In the short term, the stock has shown several patterns that indicate high uncertainty, such as a channel and a triangle formation started at the beginning of 2020.
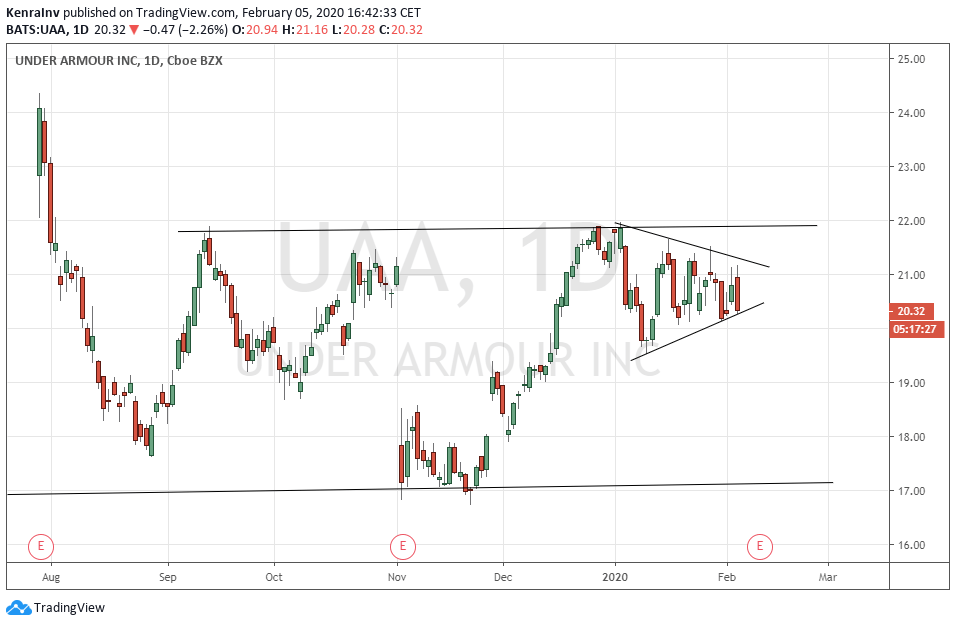
Source: tradingview.com
There will soon be a breakout or breakdown of the triangle formation, probably as a result of macro reasons and overall market conditions, rather than company-specific factors. However, the technical picture looks quite bearish despite the positive fundamental indications.
Conclusion
As a former short seller of the 2014-2015 bubble, I successfully profited from the nonsense valuation the market gave UAA at that time and the questionable growth estimates that Wall Street analysts were printing. I don’t see this as a good short anymore even though the technical picture may suggest otherwise. At least it’s not a good short on an idiosyncratic basis. The business has shown signs of improvements on many fronts, such as margins, inventory, and cash flow dynamics, to name a few. The results coming in a few days will be particularly important to determine whether the turnaround plan is still delivering the desired results. I keep UAA on my watch-list for a potential buy as I see the turnaround more credible with the improved cash flows, the cleaner inventories, and the stronger margins, but I am not ready to buy due to the bearish technical picture, the uncertainty on the macro side, and the necessary clarity that last quarter’s results should bring.
Disclosure: I/we have no positions in any stocks mentioned, and no plans to initiate any positions within the next 72 hours. I wrote this article myself, and it expresses my own opinions. I am not receiving compensation for it (other than from Seeking Alpha). I have no business relationship with any company whose stock is mentioned in this article.


