


Because of my logistics management background, I remain plugged into changes in the global and domestic logistics network. For millions of reasons including technology changes, the logistics network always is in a state of flux to maintain some state of balance.
A recent freightWaves post caught my eye:
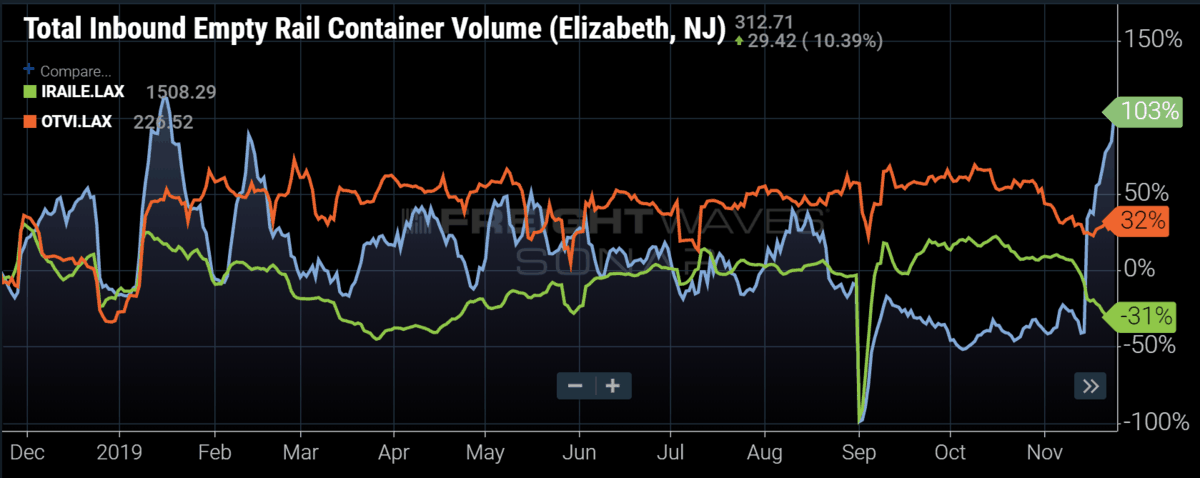
The number of empty containers moving into the Elizabeth New Jersey market over the past two weeks has almost tripled, while inbound empties moving to the Los Angeles market has dropped 46%. Pair that with the fact outbound Los Angeles trucking volumes have dropped approximately 14% since the start of November, it seems the country’s capacity is in need of re-balancing. The question to ask is whether this is a proactive or reactive move to import behaviors by the large shipping companies and what does this mean for domestic freight.
The impact of the U.S. trade war with China has been discussed ad nauseum to this point, so it would seem the international shipping companies, who own the most of the 20 and 40-foot containers in the world, have already figured out shippers have begun to ship more freight to the East Coast from Asia. Domestic 53-foot containers have also been increasingly re-positioned to the Northeast over the past several weeks.
Many shippers have started sourcing production in southern Asia versus China to avoid additional tariffs. Shipping from southern Asia directly to the U.S. East Coast via ship becomes more attractive to freight destined for the major population centers in the eastern half of the U.S. Shippers can shave a few days on the water and a few dollars when shipping through the Suez Canal in the Middle East versus the Panama Canal from China.
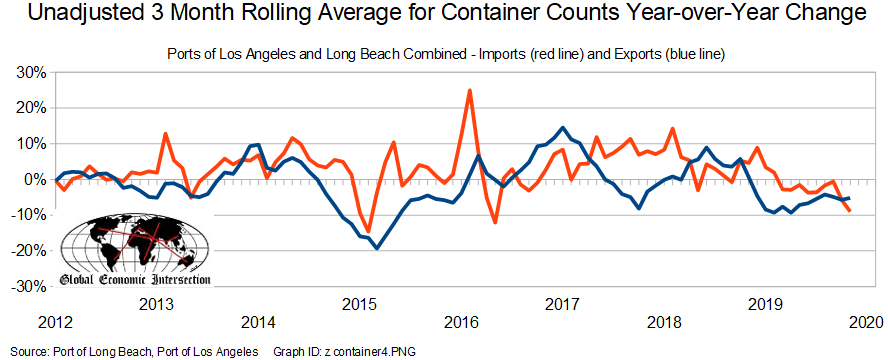
I ignore empty sea containers when I analyze transport – empty containers are a sign that imports and exports are not balanced. But I will keep my eyes open over the next few months to see if the current situation translates to higher loaded traffic. For the month of November, the Ports of Los Angeles and Long Beach inbound shipments improved but remain in contraction.
| Acceleration Month-over-Month | Change from Month One Year Ago | Year to Date vs. Previous Year | Acceleration 3 Month Rolling Average | 3 Month Rolling Average vs. Average One Year Ago | |
| Imports | +3.5% | -10.6% | -4.3% | -3.3% | -9.0% |
| Exports | +5.3% | -2.2% | -6.2% | +0.5% | -5.2% |
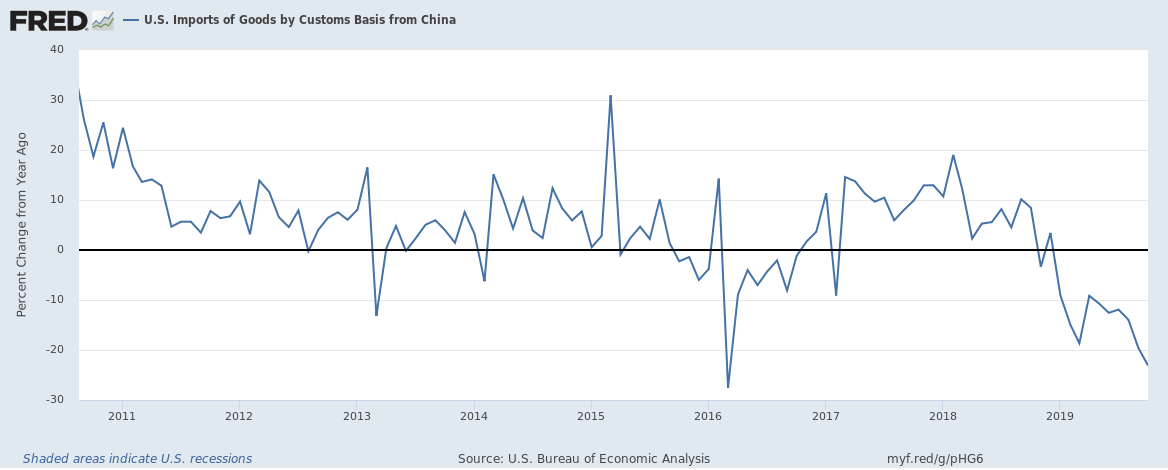
There is no question that the West Coast ports are the primary point of entry for Chinese goods which have declined over 20% year-over-year. The West Coast ports are seeing a double whammy – the trade war with China and a cheaper logistics route to the East Coast ports via the Suez Canal.
Looking at the East Coast ports, most ports’ year-to-date totals for imports are up between 7% and 8% – but there is little evidence of increasing import or export volumes of loaded containers. What is going on with empty containers will remain a mystery for now. Still, the volumes of containers passing through the Ports of Los Angeles and Long Beach are so large that the overall count of containers entering the U.S. is in contraction.
And just when we are getting used to the idea that the Suez Canal is cheaper and quicker than the Neo-Panama Canal – there is now a third option on the way:
Rosatom Group, the Russian state-run nuclear power operator, announced plans to borrow $7 billion from Russian banks to build 55 ice-class container ships to operate along the Arctic’s Northern Sea Route. In other words, if the route is to become navigable, why not take advantage by offering services on a maritime route that is approximately 30 percent shorter between Asia and Europe versus the existing route through the Suez Canal? An Arctic routing translates to 24 to 25 days of sailing versus a 34- to 35-day transit via the Suez.
What are the takeaways?
In 2020, there should be a significant improvement in West Coast container movement year-over-year growth rate as the 2020 data will be compared with the poor 2019 data.
Logistics patterns always are in a state of flux due to technology, costs, and delivery times. However, most of these changes are a slow evolutionary process taking many years.
Economic Forecast
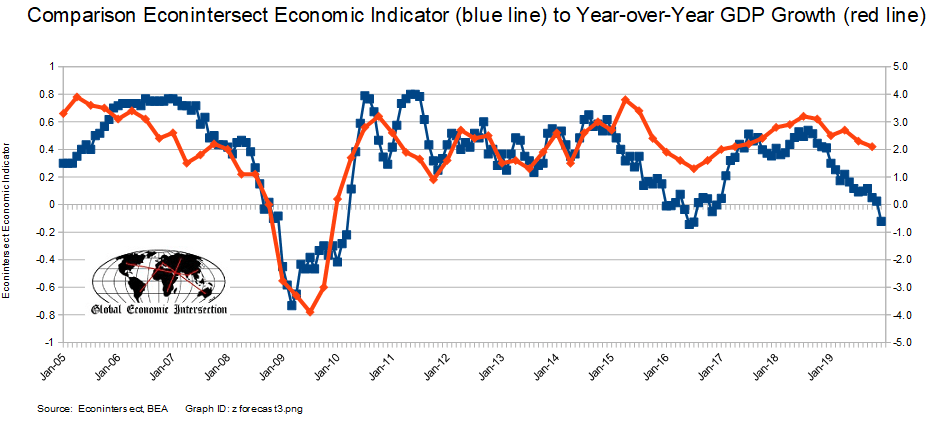
The Econintersect Economic Index (December 2019) forecast fell again this month and is now in contraction. The continuing weakness of manufacturing, transport, and exports/imports continues to weigh on our economic forecast.
Although our index is now in negative territory similar to 2016, the penetration into negative territory is not severe or persistent – and our opinion is that our index is not suggesting an economic contraction at this point.
The fundamentals which lead job growth are now showing a significant slowing growth trend in the employment growth dynamics. We are currently predicting the jobs growth to be below the growth needed to maintain participation rates and the employment-population ratios at the current levels.
Economic Releases This Past Week
The following table summarizes the more significant economic releases this past week.
Overall this week:
- inflation continues to be relatively subdued
- retail sales continue to expand at a good pace
- transport continues weak and in contraction
| Release | Potential Economic Impact | Comment | |||||||||||||||||||||
|---|---|---|---|---|---|---|---|---|---|---|---|---|---|---|---|---|---|---|---|---|---|---|---|
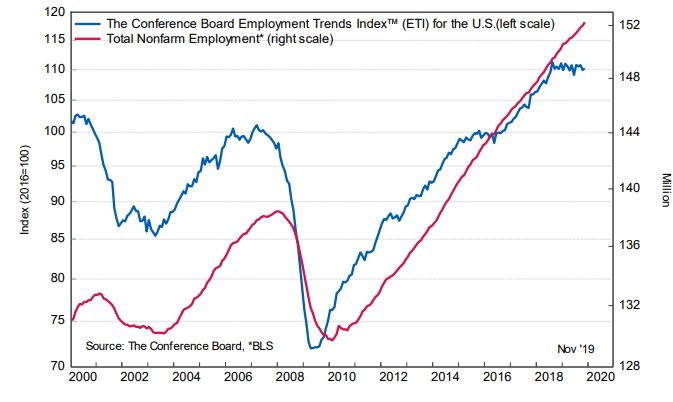
| November Conference Board Employment Trends | marginal improvement in employment forecast |
The Conference Board’s Employment Trends Index – which forecasts employment for the next 6 months – improved with the authors saying it is “suggesting solid job growth will continue in the coming months.“ Econintersect evaluates the year-over-year change of this index (which is different than the headline view) – as we do with our own employment index. The year-over-year index growth rate accelerated by 0.5% month-over-month and up by 0.1% year-over-year. The Econintersect employment index also increased. Both of these indices are predicting soft job growth 6 months from now.
|
|||||||||||||||||||||
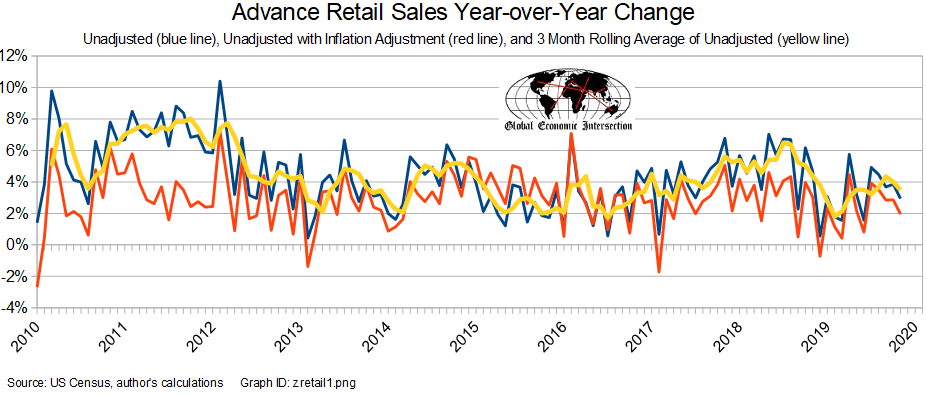
| November Retail Sales | the rolling averages slowed |
Retail sales improved according to US Census headline data. There was an upward adjustment to last month’s data. The real test of strength is the rolling averages, which declined. Overall, this report is considered marginally worse relative to last month. We are seeing a growth rate slowing trend.
|
|||||||||||||||||||||
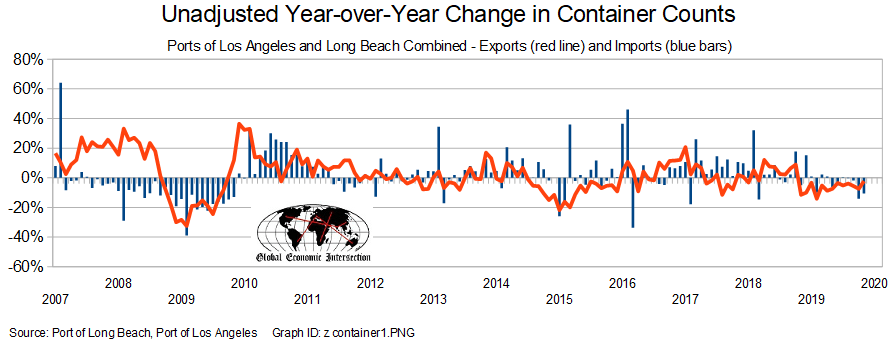
| November Container Counts | in contraction but improving | Although the year-over-year data is in contraction for the Ports of Los Angeles and Long Beach, the data is improving.
Simply looking at this month versus last month – this month was an improvement over last month. The year-over-year rate of growth improved for imports and improved for exports. Year-to-date growth for both imports and exports remain deep in contraction. Some pundits think that the new Panama Canal locks have affected the West Coasts container counts – our analysis is that there is little impact. Many do not understand that the new locks are more expensive per ton. However, a new trend is developing where the Suez Canal is being used more for shipments to the U.S. east coast. The three-month rolling averages for exports and imports are also in contraction.
|
|||||||||||||||||||||
| October Business Inventories | inventory levels slowly improving |
Headlines say final business sales data (retail plus wholesale plus manufacturing) declined month-over-month. The rolling averages declined. Inventories remain elevated but improved. Our primary monitoring tool – the 3-month rolling averages for sales – declined. As the monthly data has significant variation, the 3-month averages are the way to view this series. Overall business sales are better than the low point in 2015 – but are well below average for the values seen in the last 2 years. Note that inflation-adjusted sales are in contraction. Seasonally Adjusted Business Inventories Year-over-Year Change – Inventory Value (blue line, left axis) and Inventory-to-Sales Ratio (red line, right axis)
|
|||||||||||||||||||||
|
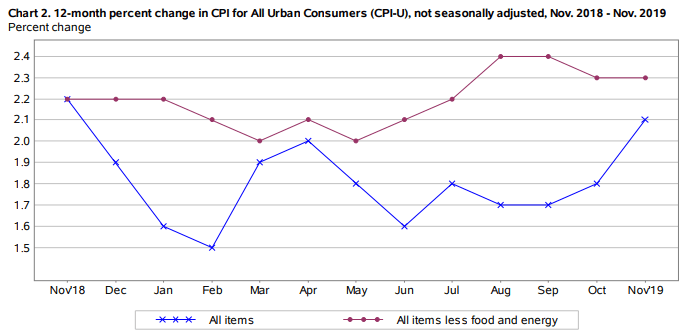
November Consumer Price Index |
n/a |
According to the BLS, the Consumer Price Index (CPI-U) year-over-year inflation rate was 2.1% year-over-year (up from the reported 1.8% last month). The year-over-year core inflation (excluding energy and food) rate was unchanged at 2.3% and remains above the target set by the Federal Reserve. Energy and shelter were the main reasons for the increase in this index. Medical care services cost inflation was unchanged at 5.1% year-over-year.
|
|||||||||||||||||||||
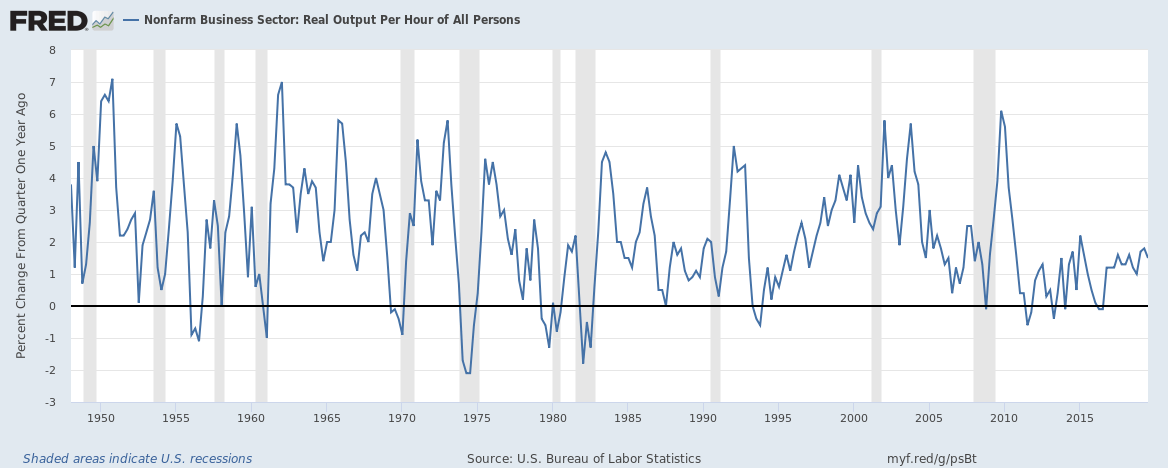
| 3Q2019 Productivity | year-over-year productivity growth good |
A simple summary of the headlines for this release is that labor costs are growing significantly faster than productivity. The overall view this quarter is that productivity is up 1.5% from the same quarter one year ago (last quarter productivity was up 2.5%), while unit costs are up 2.2% (last quarter labor costs were up a revised 0.1%). Annualized snippets of monthly or quarterly data distort what is going on. In reality, productivity growth is near post-Great Recession highs using a year-over-year analysis.
|
|||||||||||||||||||||
| December FOMC Meeting Statement | little change |
The Federal Open Market Committee (FOMC) – the board of directors of the Federal Reserve – maintained the federal funds rate at 1‑1/2 to 1-3/4 as expected, and stated:
Overall the Fed appears to believe the economy is little changed since the last meeting. |
|||||||||||||||||||||
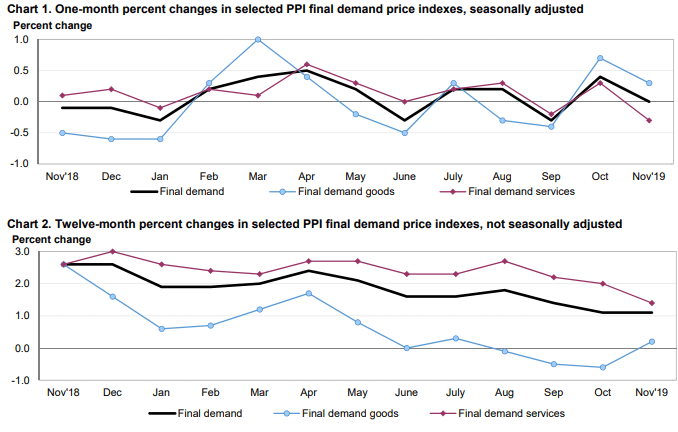
| November Producer Price Index | n/a |
The producer price inflation breakdown:
|
|||||||||||||||||||||
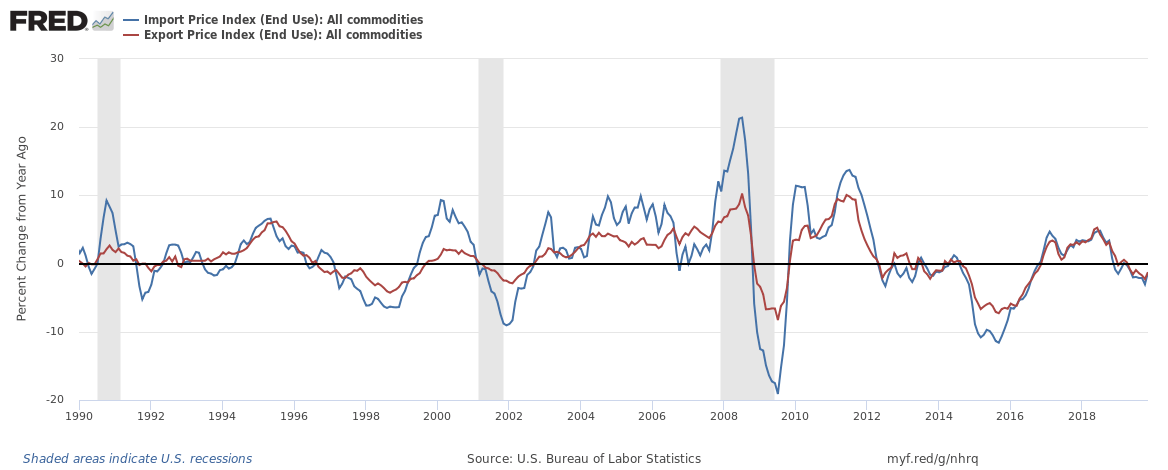
| November Import / Export Price Index | n/a |
Import prices grew from -3.0% to -1.3% while export pricing grew from -2.2% to -1.3% – and both imports and exports remain in contraction.
|
|||||||||||||||||||||
| Surveys | business optimism remains relatively high |
November Small Business Optimism – Small business optimism posted the largest month-over-month gain since May 2018, rising 2.3 points to 104.7 in November. The exceptional Optimism Index reading was bolstered by seven of the 10 Index components advancing, led by a 10-point improvement in earnings.
|
|||||||||||||||||||||
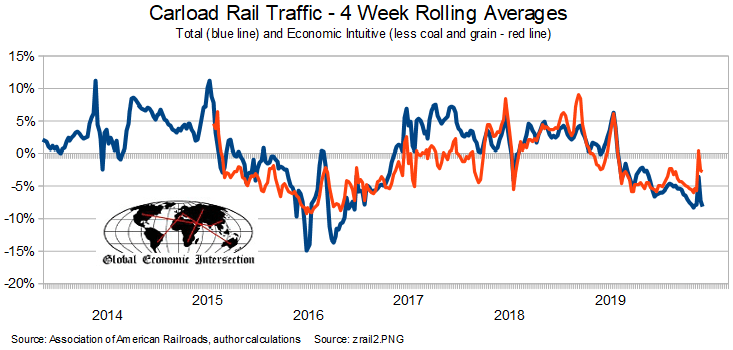
| Rail Movements | Definitely not positive news |
Rail so far in 2019 has changed from a reflection of a strong economic engine to contraction. Currently, not only are the economic intuitive components of rail in contraction, but the year-to-date has slipped into contraction.
|
My usual weekly wrap is in my instablog.
Disclosure: I/we have no positions in any stocks mentioned, and no plans to initiate any positions within the next 72 hours. I wrote this article myself, and it expresses my own opinions. I am not receiving compensation for it. I have no business relationship with any company whose stock is mentioned in this article.


