


Art Berman, a petroleum geologist who has been interviewed for past Seeking Alpha articles, was recently interviewed on MacroVoices and published an article which concluded that “when those counter-parties realize that nothing in the world has fundamentally changed, prices will fall to $51 or $52 as they have with the last three failed rallies of 2019.” I agree with him and found it interesting that the article is far different than the “moonshot” projection he had for oil prices a few years ago has been so dramatically revised.
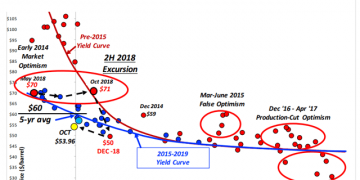
He discussed his theory that his “Yield Curve” Comparative Inventory System (“CI”) “provides a reliable correlation between secular trends in oil-price, and stocks of crude oil and refined products. Rising stock levels correspond to falling prices and vice versa.” In economics, a yield curve is a line that plots yields (interest rates) of bonds having equal credit quality but differing maturity dates. But in Berman’s “Yield Curve,” the X-axis is the difference between current inventories and the 5-year average, and the Y-Axis is the price of WTI crude oil.
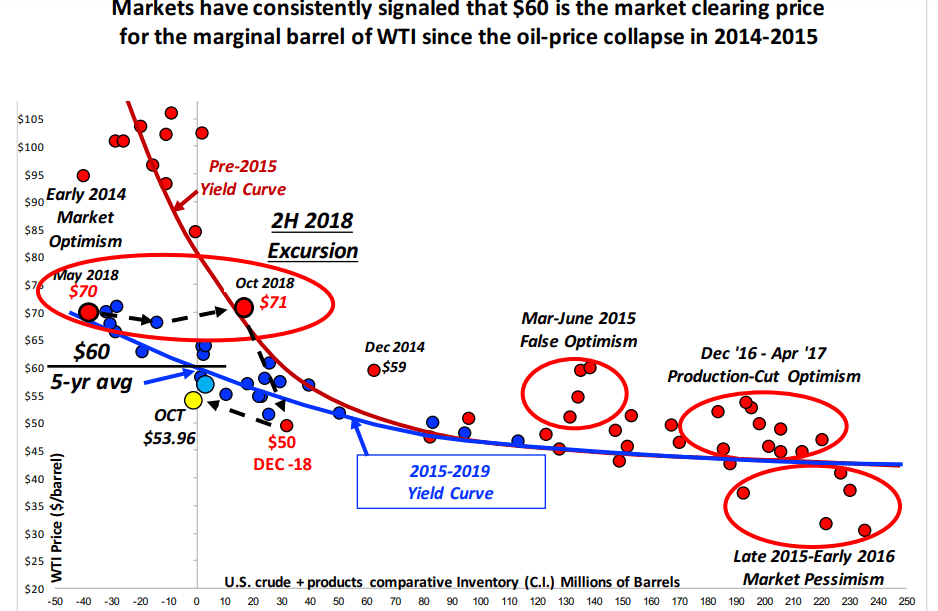
Source: Art Berman
I agree that oil inventories can explain much of the range of oil prices. And this is in direct contrast to a recent MacroVoices interview I reviewed in which Mark Gordon stated that “sentiment or the overall regime drives price, not the level of inventories.” However, I do not agree with Berman’s theory that there is a very large, unreported stash of crude oil inventories in the U.S. that can be brought online with the flip of a switch.
Excursions
Berman explains that prices deviate from his Yield Curve due to market price discovery “excursions.” For example, in late 2015, early 2016, market pessimism led to a low-price excursion below the yield curve. He admitted in the interview that he has no way of knowing when such excursions will occur, when they will end, or how far they will go.
A few other observations. There are two yield curves in the diagram, a pre-2015 curve and one labeled 2015-2019. He did not provide an explanation for why there are two, how they are derived, or if he has a way of predicting the next one.
In my process, I use 10 years of data and perform regression analysis. The time period is somewhat arbitrary, but it covers enough time in my opinion to give me representative of different price regimes. So each year one year drops off and another one is added. The regression analysis is an objective, statistically-based approach which provides an r-squared (goodness-of-fit).

It also provides fitted-values for past months and price projections for future months, given an inventory forecast. I used the December EIA Short-Term Energy Outlook (STEO) predictions of future OECD inventories to arrive at a prediction of WTI futures prices, given the model above.

Comparing prices from the regression to crude futures dated December 10th, the regression implies crude prices will drop in 2020, approaching $45 by year-end, based on the inventory forecast.
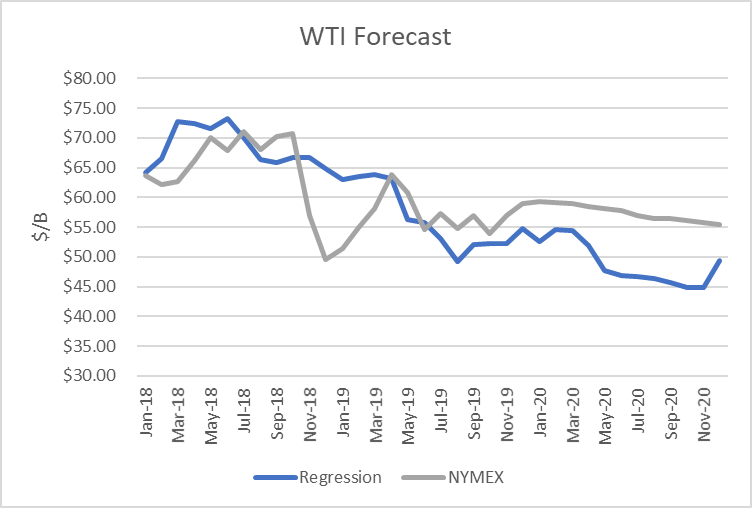
As expectations for future global inventories change, so will the price forecast. It provides a framework for price expectations.
The regression analysis is of limited value because it does not show by itself the profitability and risk of a trading system designed to take positions based on it. I have designed and back-tested trading systems of that type and the insights provided are well worth the effort.
I have previously discussed that market sentiment plays a major role in the formation and movement of oil market prices. And I have designed a methodology and back-tested it with daily trading simulations. To test it properly, there should be an “in-sample” period and an “out-of-sample” period. That article is published here.
Conclusions
I was delighted to see Mr. Berman move beyond the “moonshot” phase to an inventory-based analysis. And I have suggested how that analysis can be extended to include projections and trading simulations. Finally, I believe that market sentiment plays an important role in how I approach incorporating that component.
To guide investors who are interested in profiting from outstanding opportunities in the energy sector, I provide a service on Seeking Alpha’s Marketplace oriented toward individual investors, Boslego Risk Services. A long/short Model portfolio is continuously updated, along with on-going analysis of the oil market.
I am now accepting new members to Boslego Risk Services and invite you to sign-up. There are monthly and annual pricing options as described here. You may also read reviews posted by members here.
Disclosure: I/we have no positions in any stocks mentioned, and no plans to initiate any positions within the next 72 hours. I wrote this article myself, and it expresses my own opinions. I am not receiving compensation for it (other than from Seeking Alpha). I have no business relationship with any company whose stock is mentioned in this article.


